Running a successful accounting firm means making countless decisions—how to allocate resources, who to hire, which clients to prioritize, and how to ensure work gets delivered on time. But making those decisions without clear visibility into your firm’s performance is like flying blind.
That’s why we’re excited to introduce a powerful suite of new advanced reporting features in your favourite all-in-one accounting practice management software, Financial Cents—built to give you the real-time insights you need to grow and manage your firm effectively.
Whether you’re tracking team productivity, identifying workflow bottlenecks, or gaining a clearer picture of your firm’s financial health, our new reports deliver the answers in just a few clicks.
Let’s walk you through what’s new and how each report can help you make smarter, faster decisions.
Team Performance & Productivity Reports
1. Realization & Profitability Report
Want to know how profitable your firm really is?
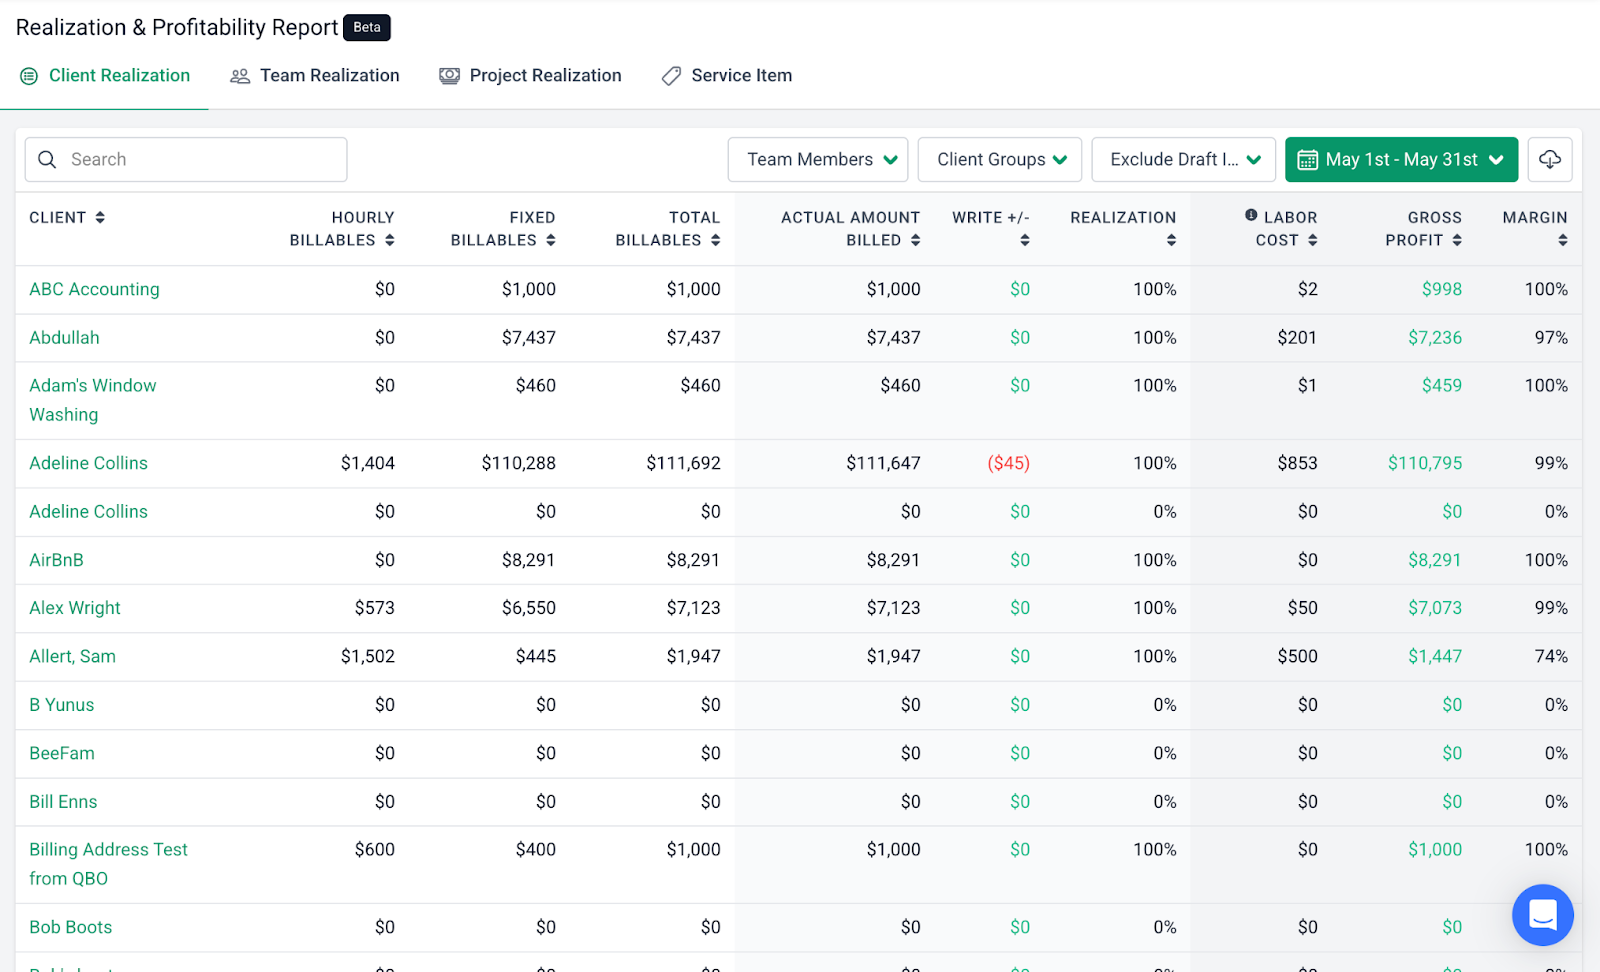
The Realization Report in Financial Cents gives you a clear picture of how efficiently your firm is converting work into revenue by helping you compare total billables vs amount you billed clients. You can view the report across clients, team, projects and services.
Unlike basic industry realization reports, Financial Cents provides you with additional built-in profitability insights. The profitability report helps you to quickly identify which clients, team members, projects, or services are driving profit (or not) by showing you your gross profit and profit margin.
Use it to:
- Evaluate employee productivity & profitability.
- Identify your most profitable clients.
- Improve your pricing strategies
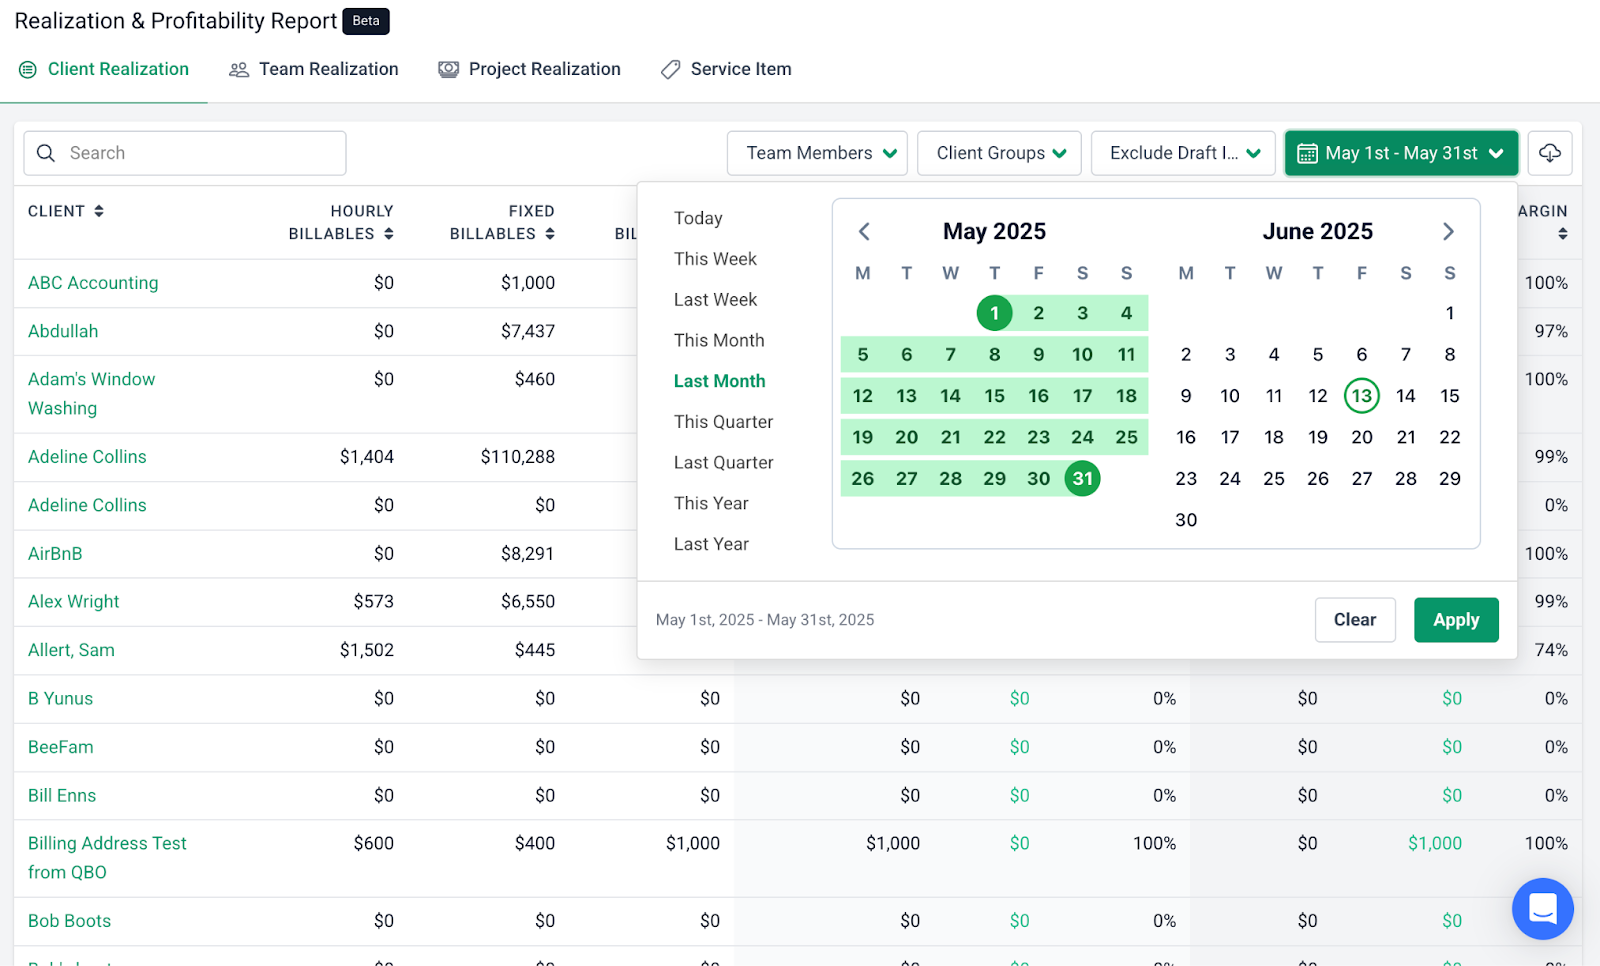
You can filter the report by date, client group, etc. to drill down the report to get valuable insights relevant to your firm and exclude draft invoices.
How to Access This Report:
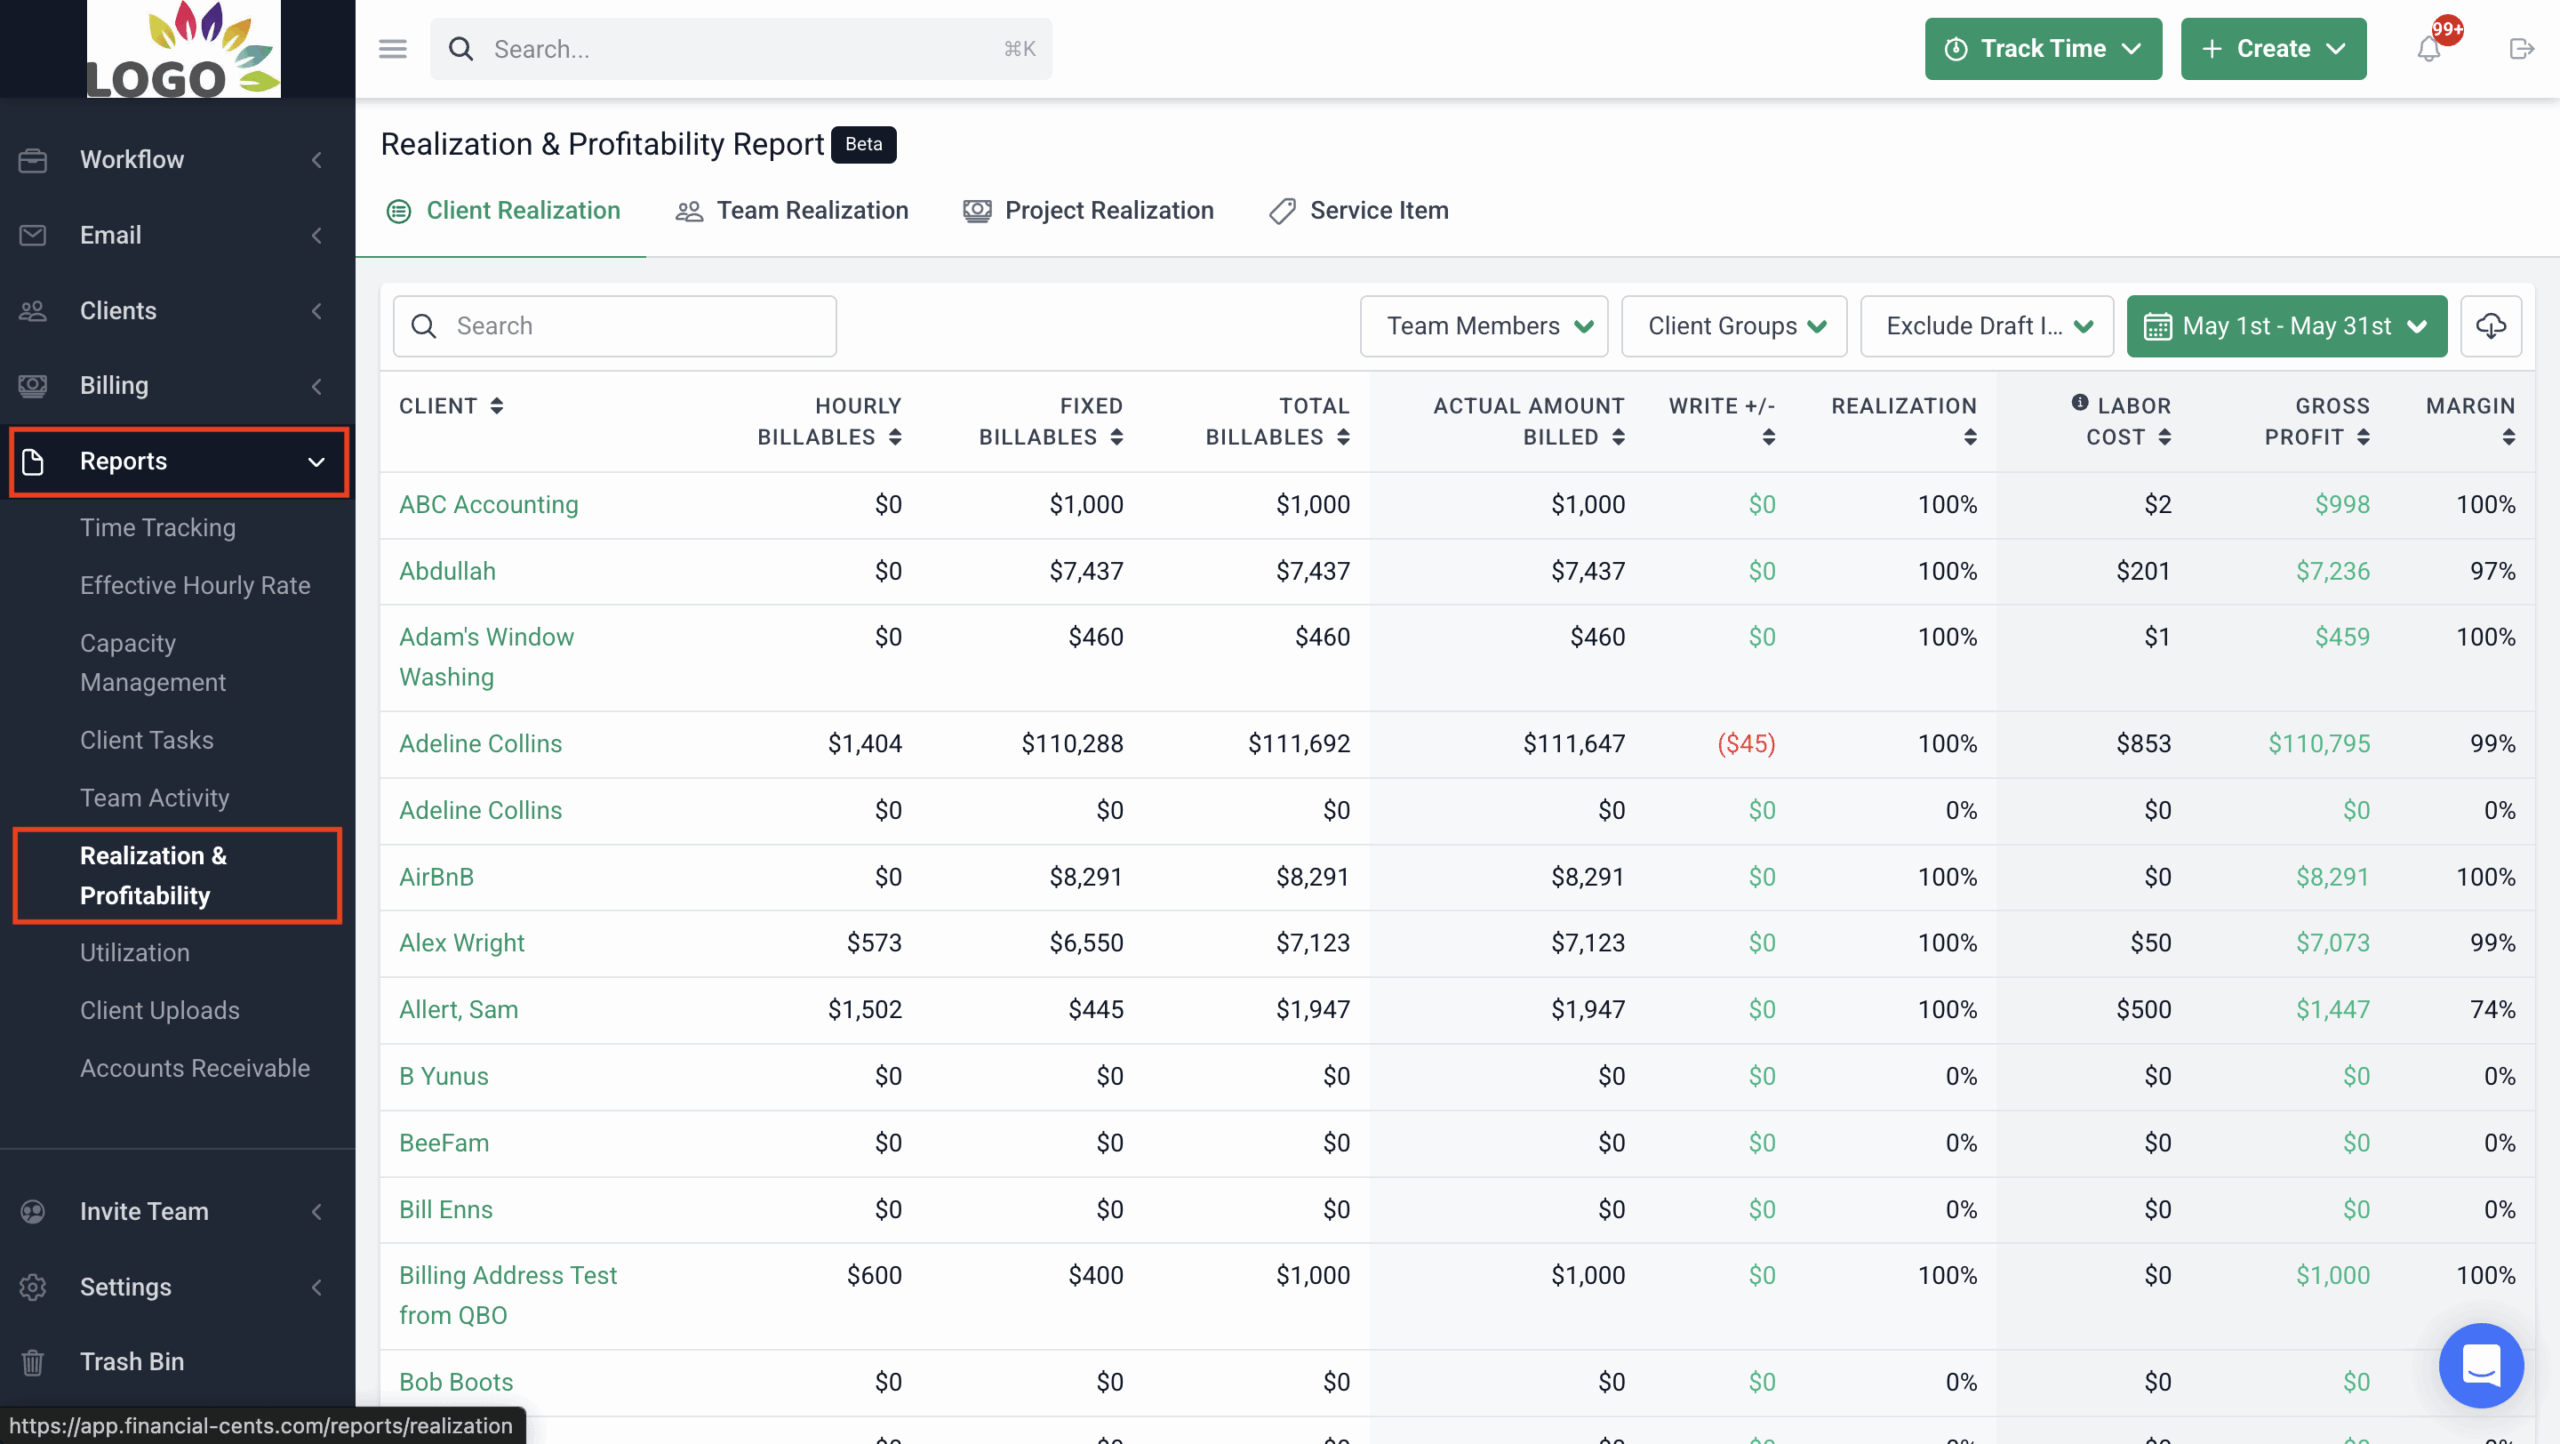
Step 1: From the Financial Cents dashboard, click on the Reports tab at the sidebar by the left.
Step 2: Click the Realization & Profitability Report from the list of reports.
Please note:
- You must be invoicing clients out of Financial Cents to use this report.
- Realization is based on invoices sent, not invoices paid
- When you adjust the $ amount on an invoice, it will automatically record it as a markup or down in the realization report
Learn more about how the Realization Report works
2. Utilization Report
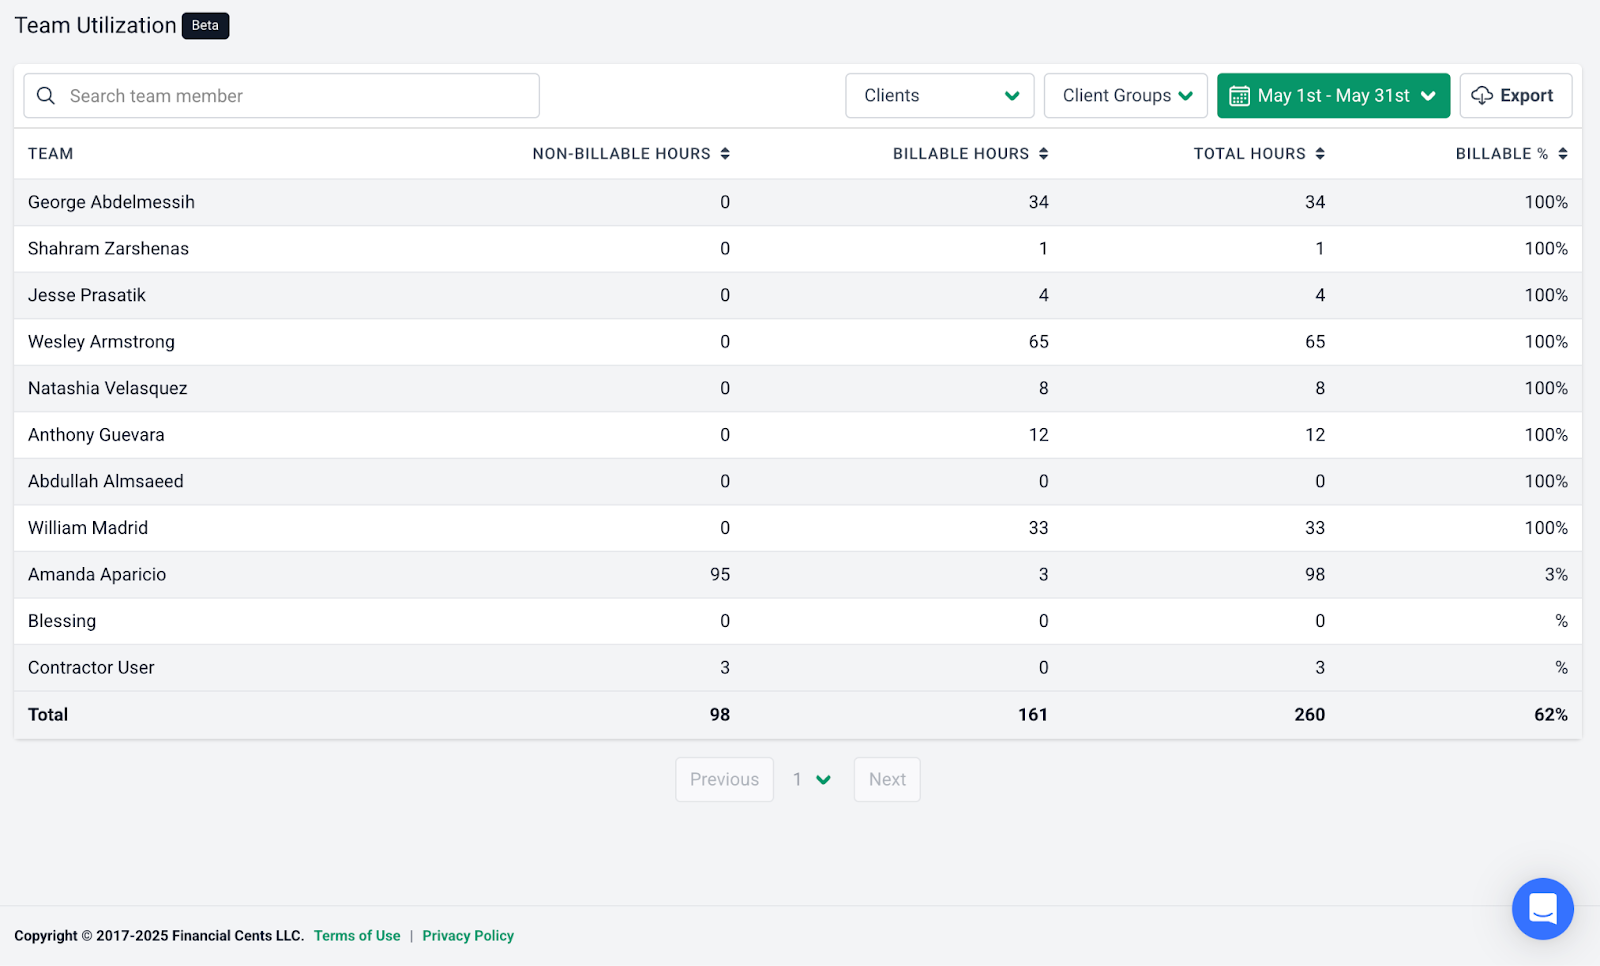
The Utilization Report shows how much of your team’s available time is being used on billable work vs non-billable work. This is key to understanding each of your team member’s performance.
It also provides you with a holistic view of how much your firm spends on billable work.
Use it to:
- Monitor billable vs. non-billable hours
- Spot over- or under-utilization trends
- Plan team workloads more effectively
Just like the realization and profitability report, you can also filter by date, client group, etc
How to Access This Report:
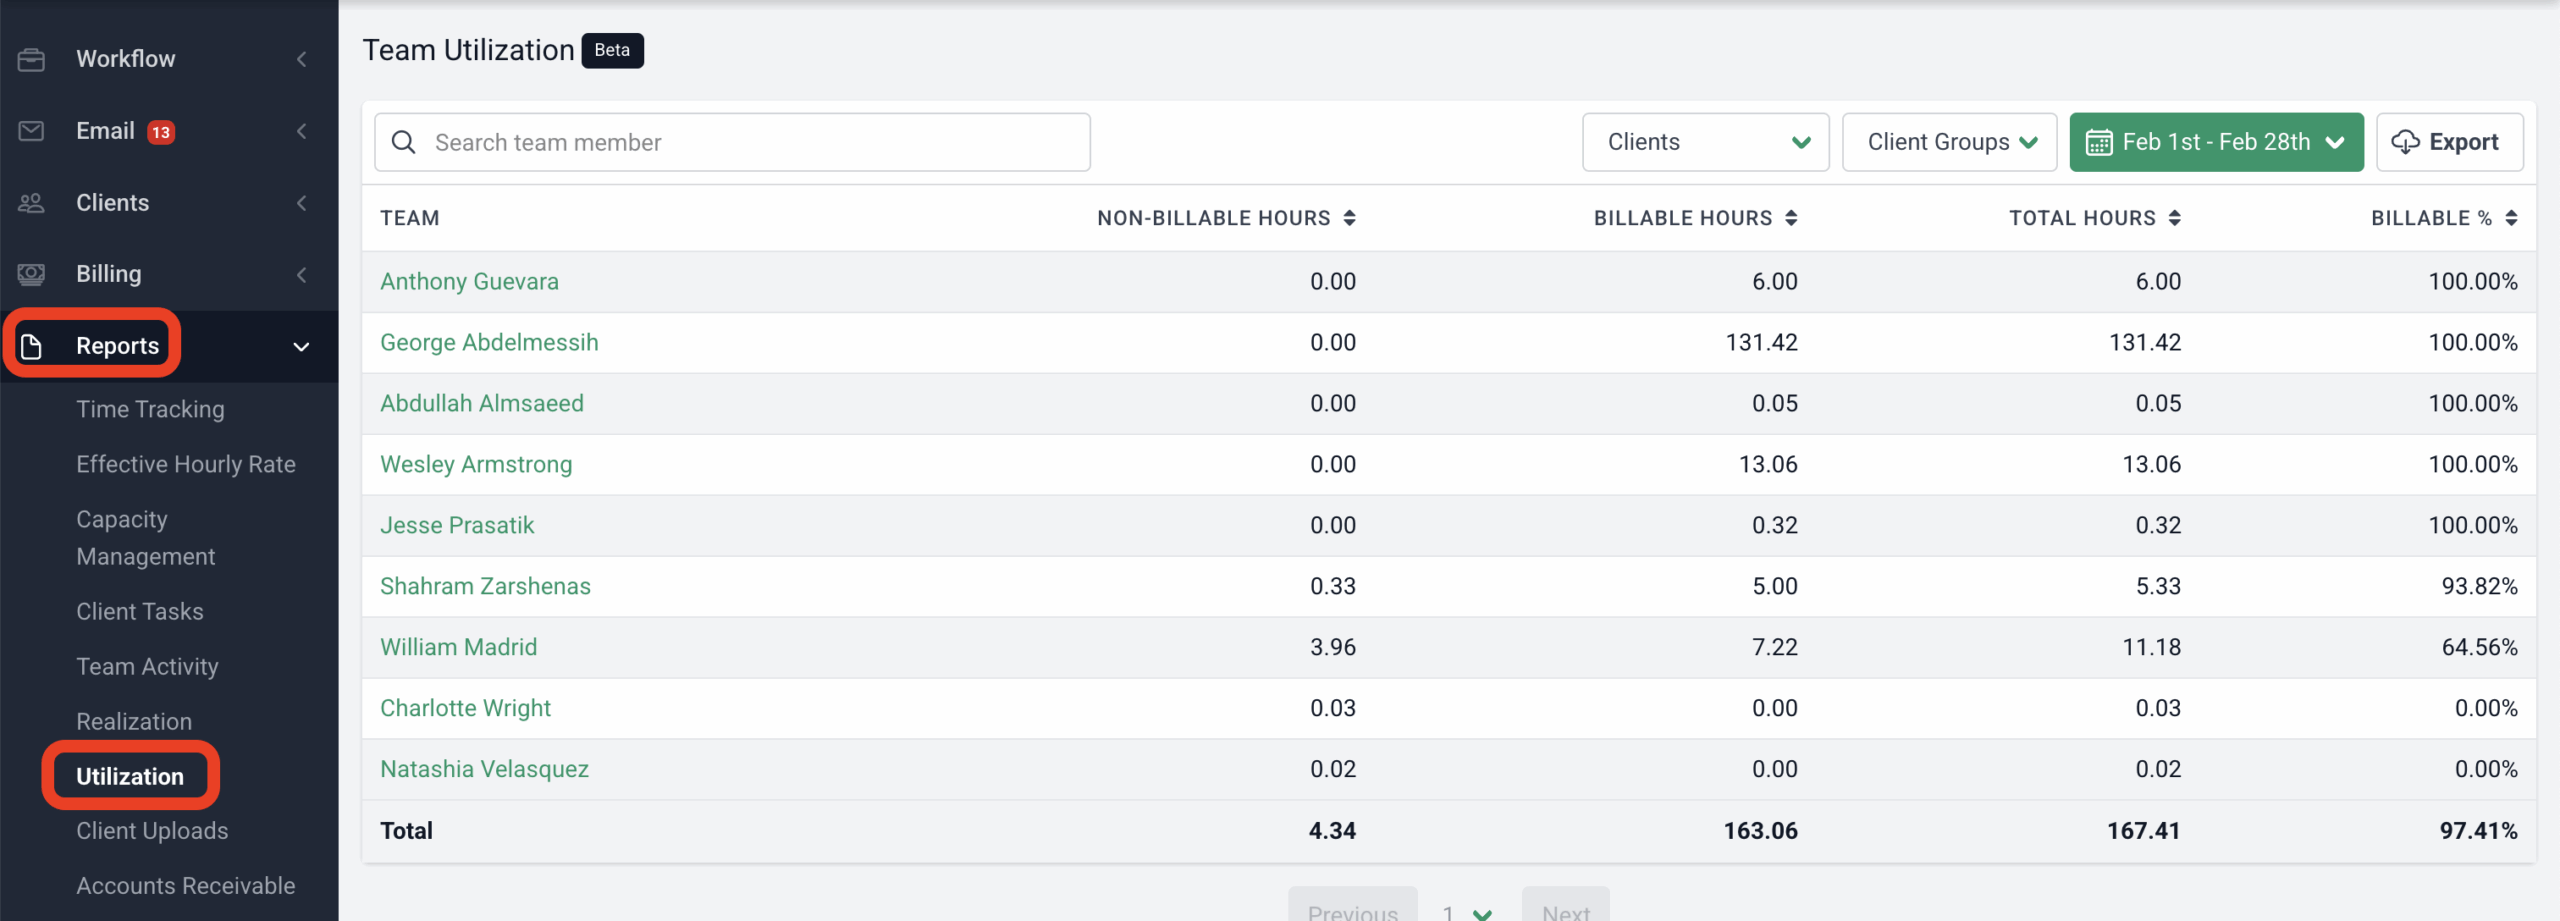
Step 1: From the Financial Cents dashboard click on the Reports tab at the sidebar by the left.
Step 2: Click Utilization from the list of reports.
Learn more about the Utilization Report
3. Effective Hourly Rate Report
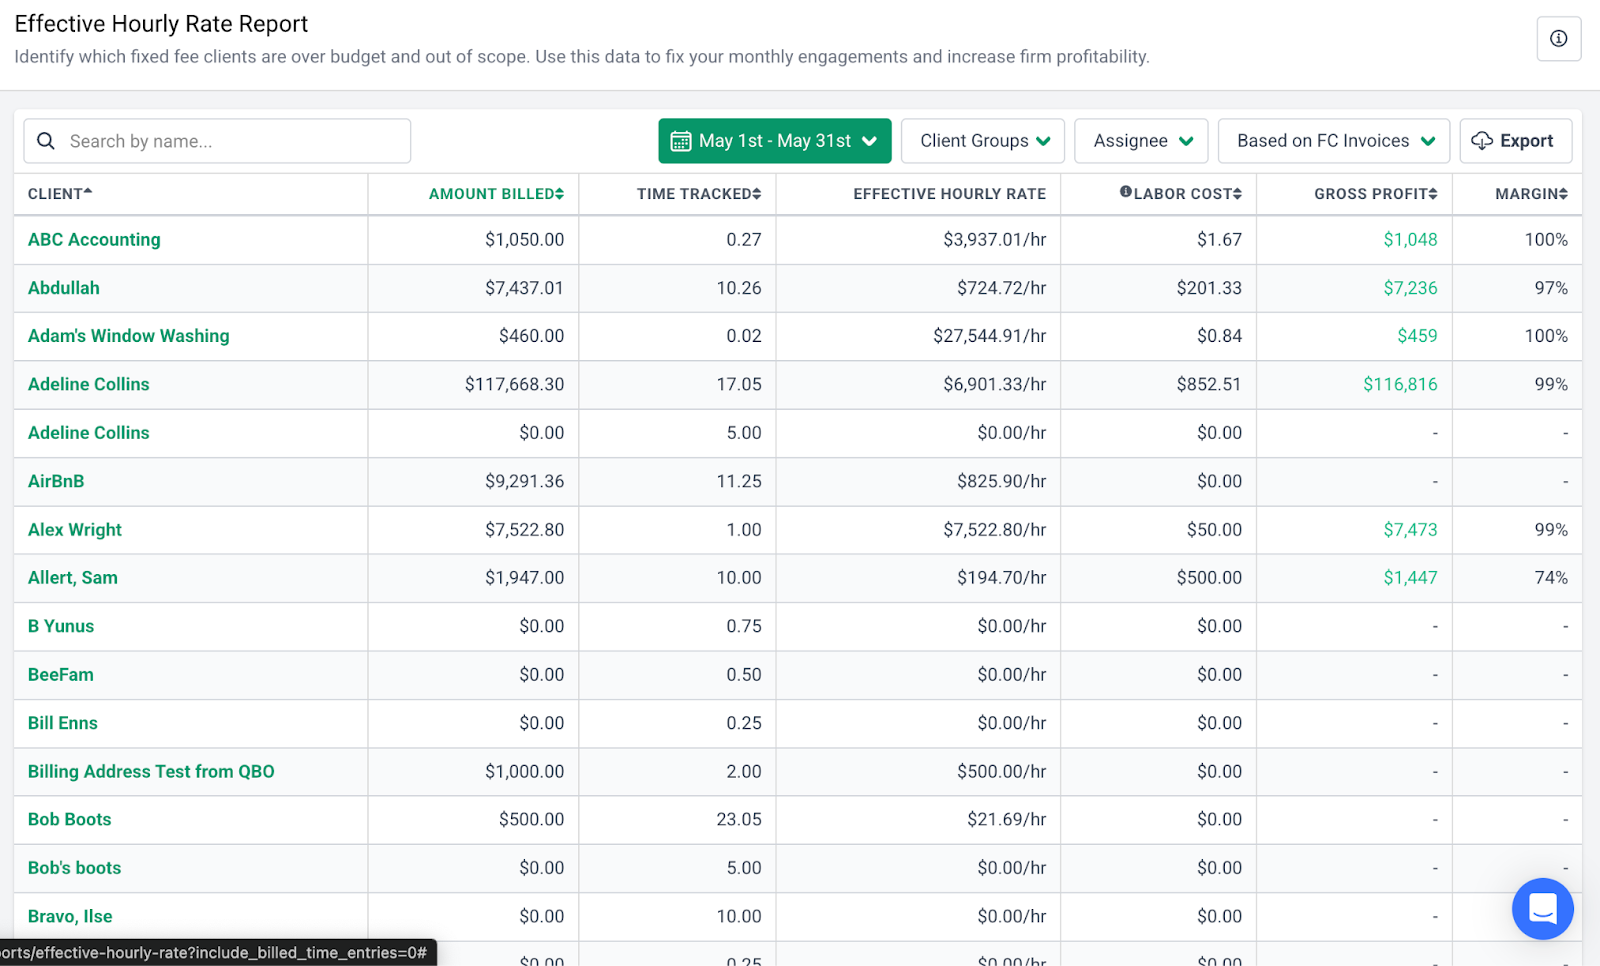
This report makes it easy to compare how much you’re billing each client versus how much time your team is spending on them. In other words, it tells you whether the work you’re doing is worth your time.
The report gives you a breakdown of your actual earnings per hour for each client based on tracked time and billed revenue.
Use it to:
- Identify out-of-scope clients who take more time than they pay for
- Spot profitability leaks before they become major issues
- Take action by increasing pricing or refining your client list
How to Access This Report:
There are two ways to view the Effective Hourly Rate Report in Financial Cents:
1. Firm-wide View:
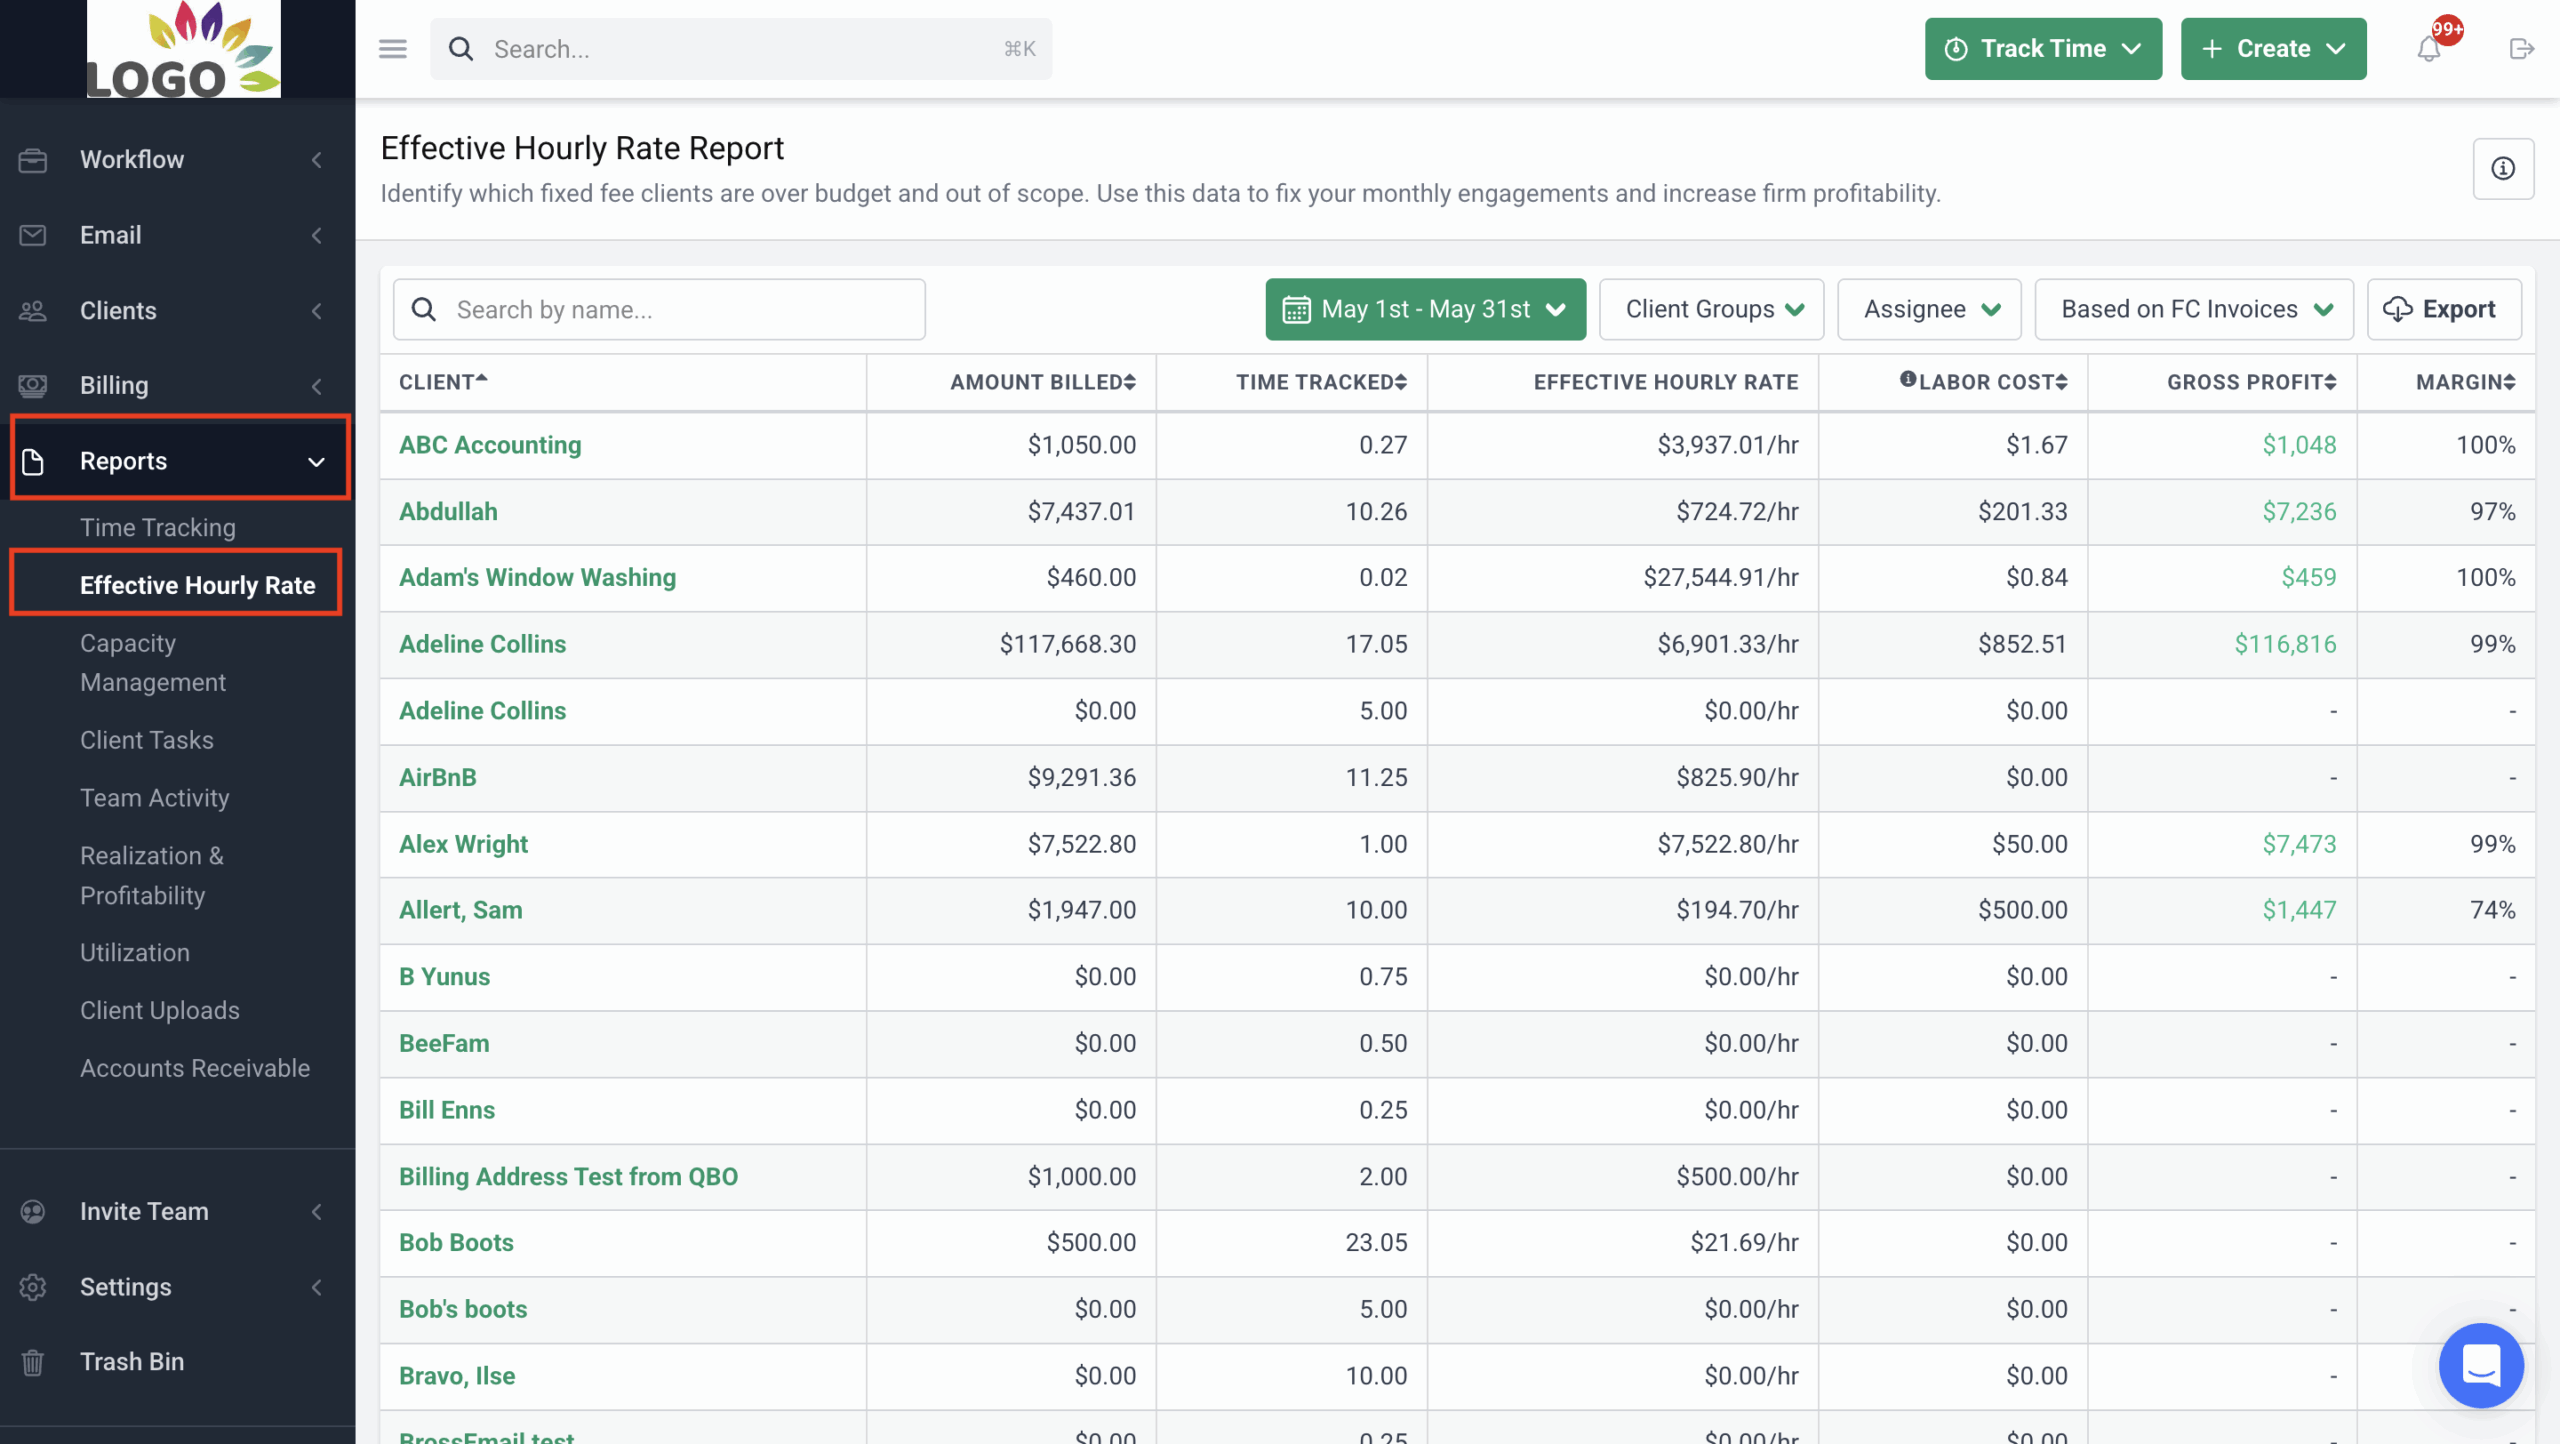
Step 1: From the Financial Cents dashboard, click on the Reports tab at the sidebar by the left.
Step 2: Click on Effectively Hourly Rate from the list of reports.
2. Client-specific View:
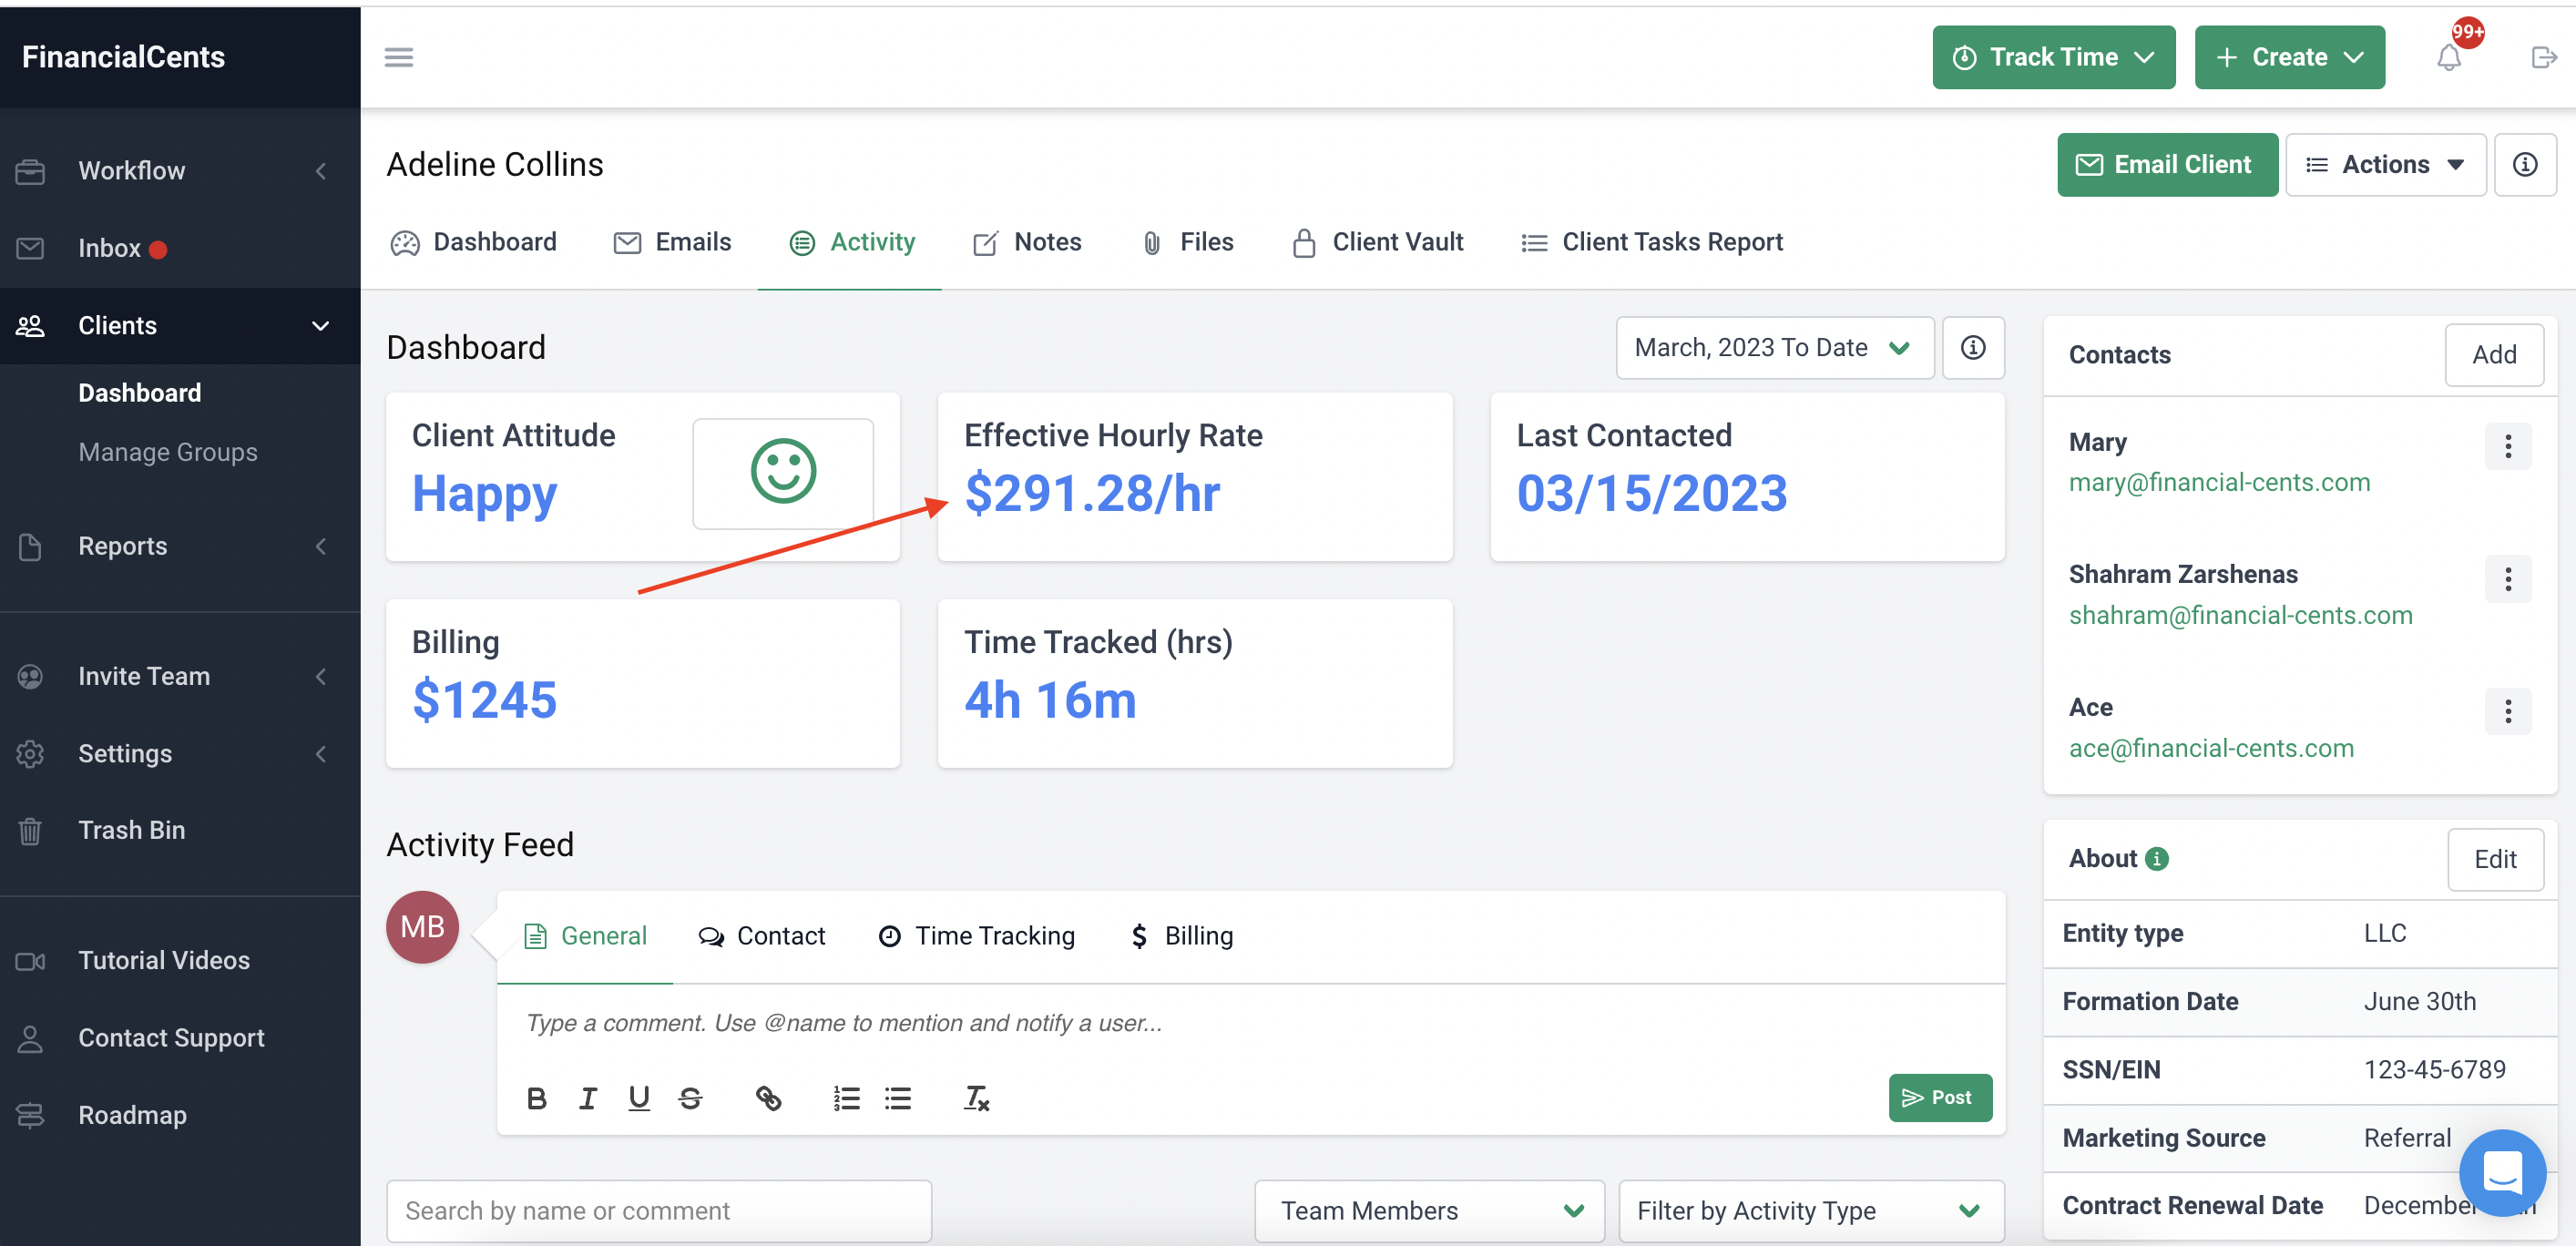
Explore the Effective Hourly Rate Report
Project and Workflow Insights
4. Work Insights Report
Curious how efficiently your firm is getting work done?
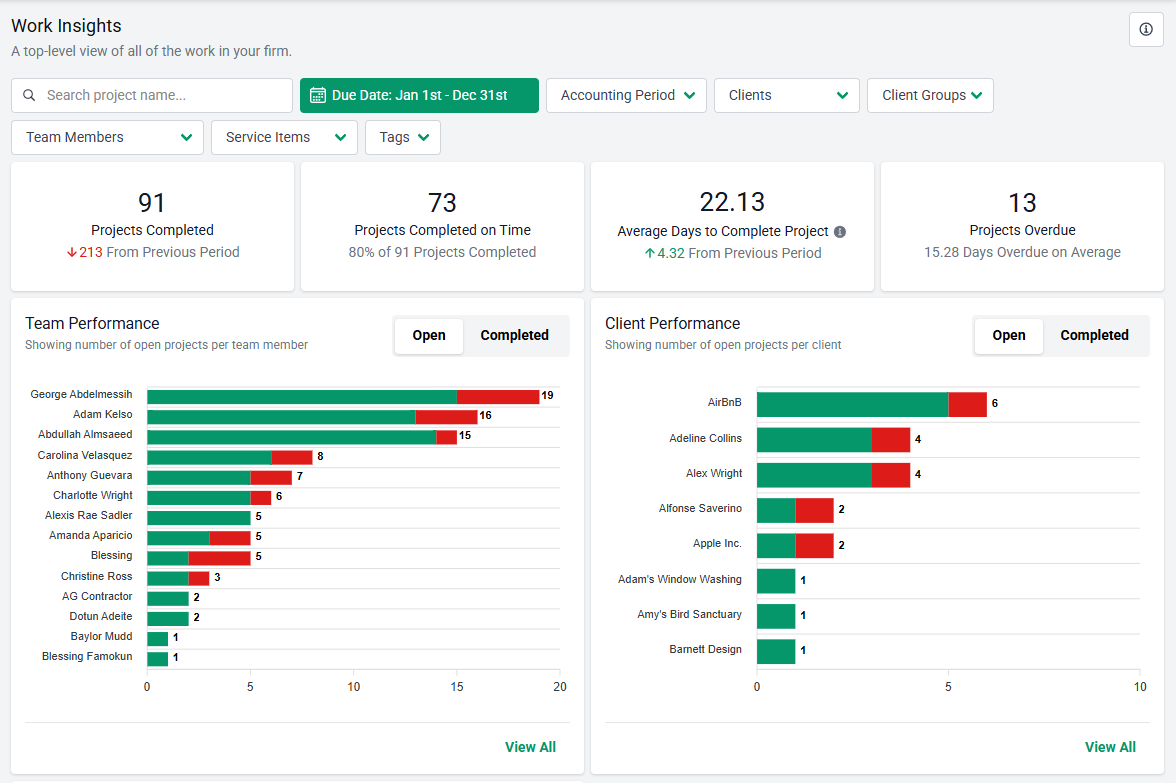
The Work Insights Report gives a high-level overview of work completion rates, average task turnaround times, and how often work is overdue. It’s a great way to identify workflow bottlenecks and improve team processes.
With the Work Insights Report, you can view key metrics such as:
- Total number of completed projects
- Percentage of projects completed on time
- Average number of days it takes to complete a project
- Number of overdue projects
- Open vs. closed projects by team member
- Open vs. completed projects for each client
- Number of projects by tag or status
Use this report to monitor firm-wide performance, improve workflows, and ensure your team stays on track. Whether you’re managing two team members or twenty, the Work Insights Report helps you lead with confidence and clarity.
How to Access This Report:
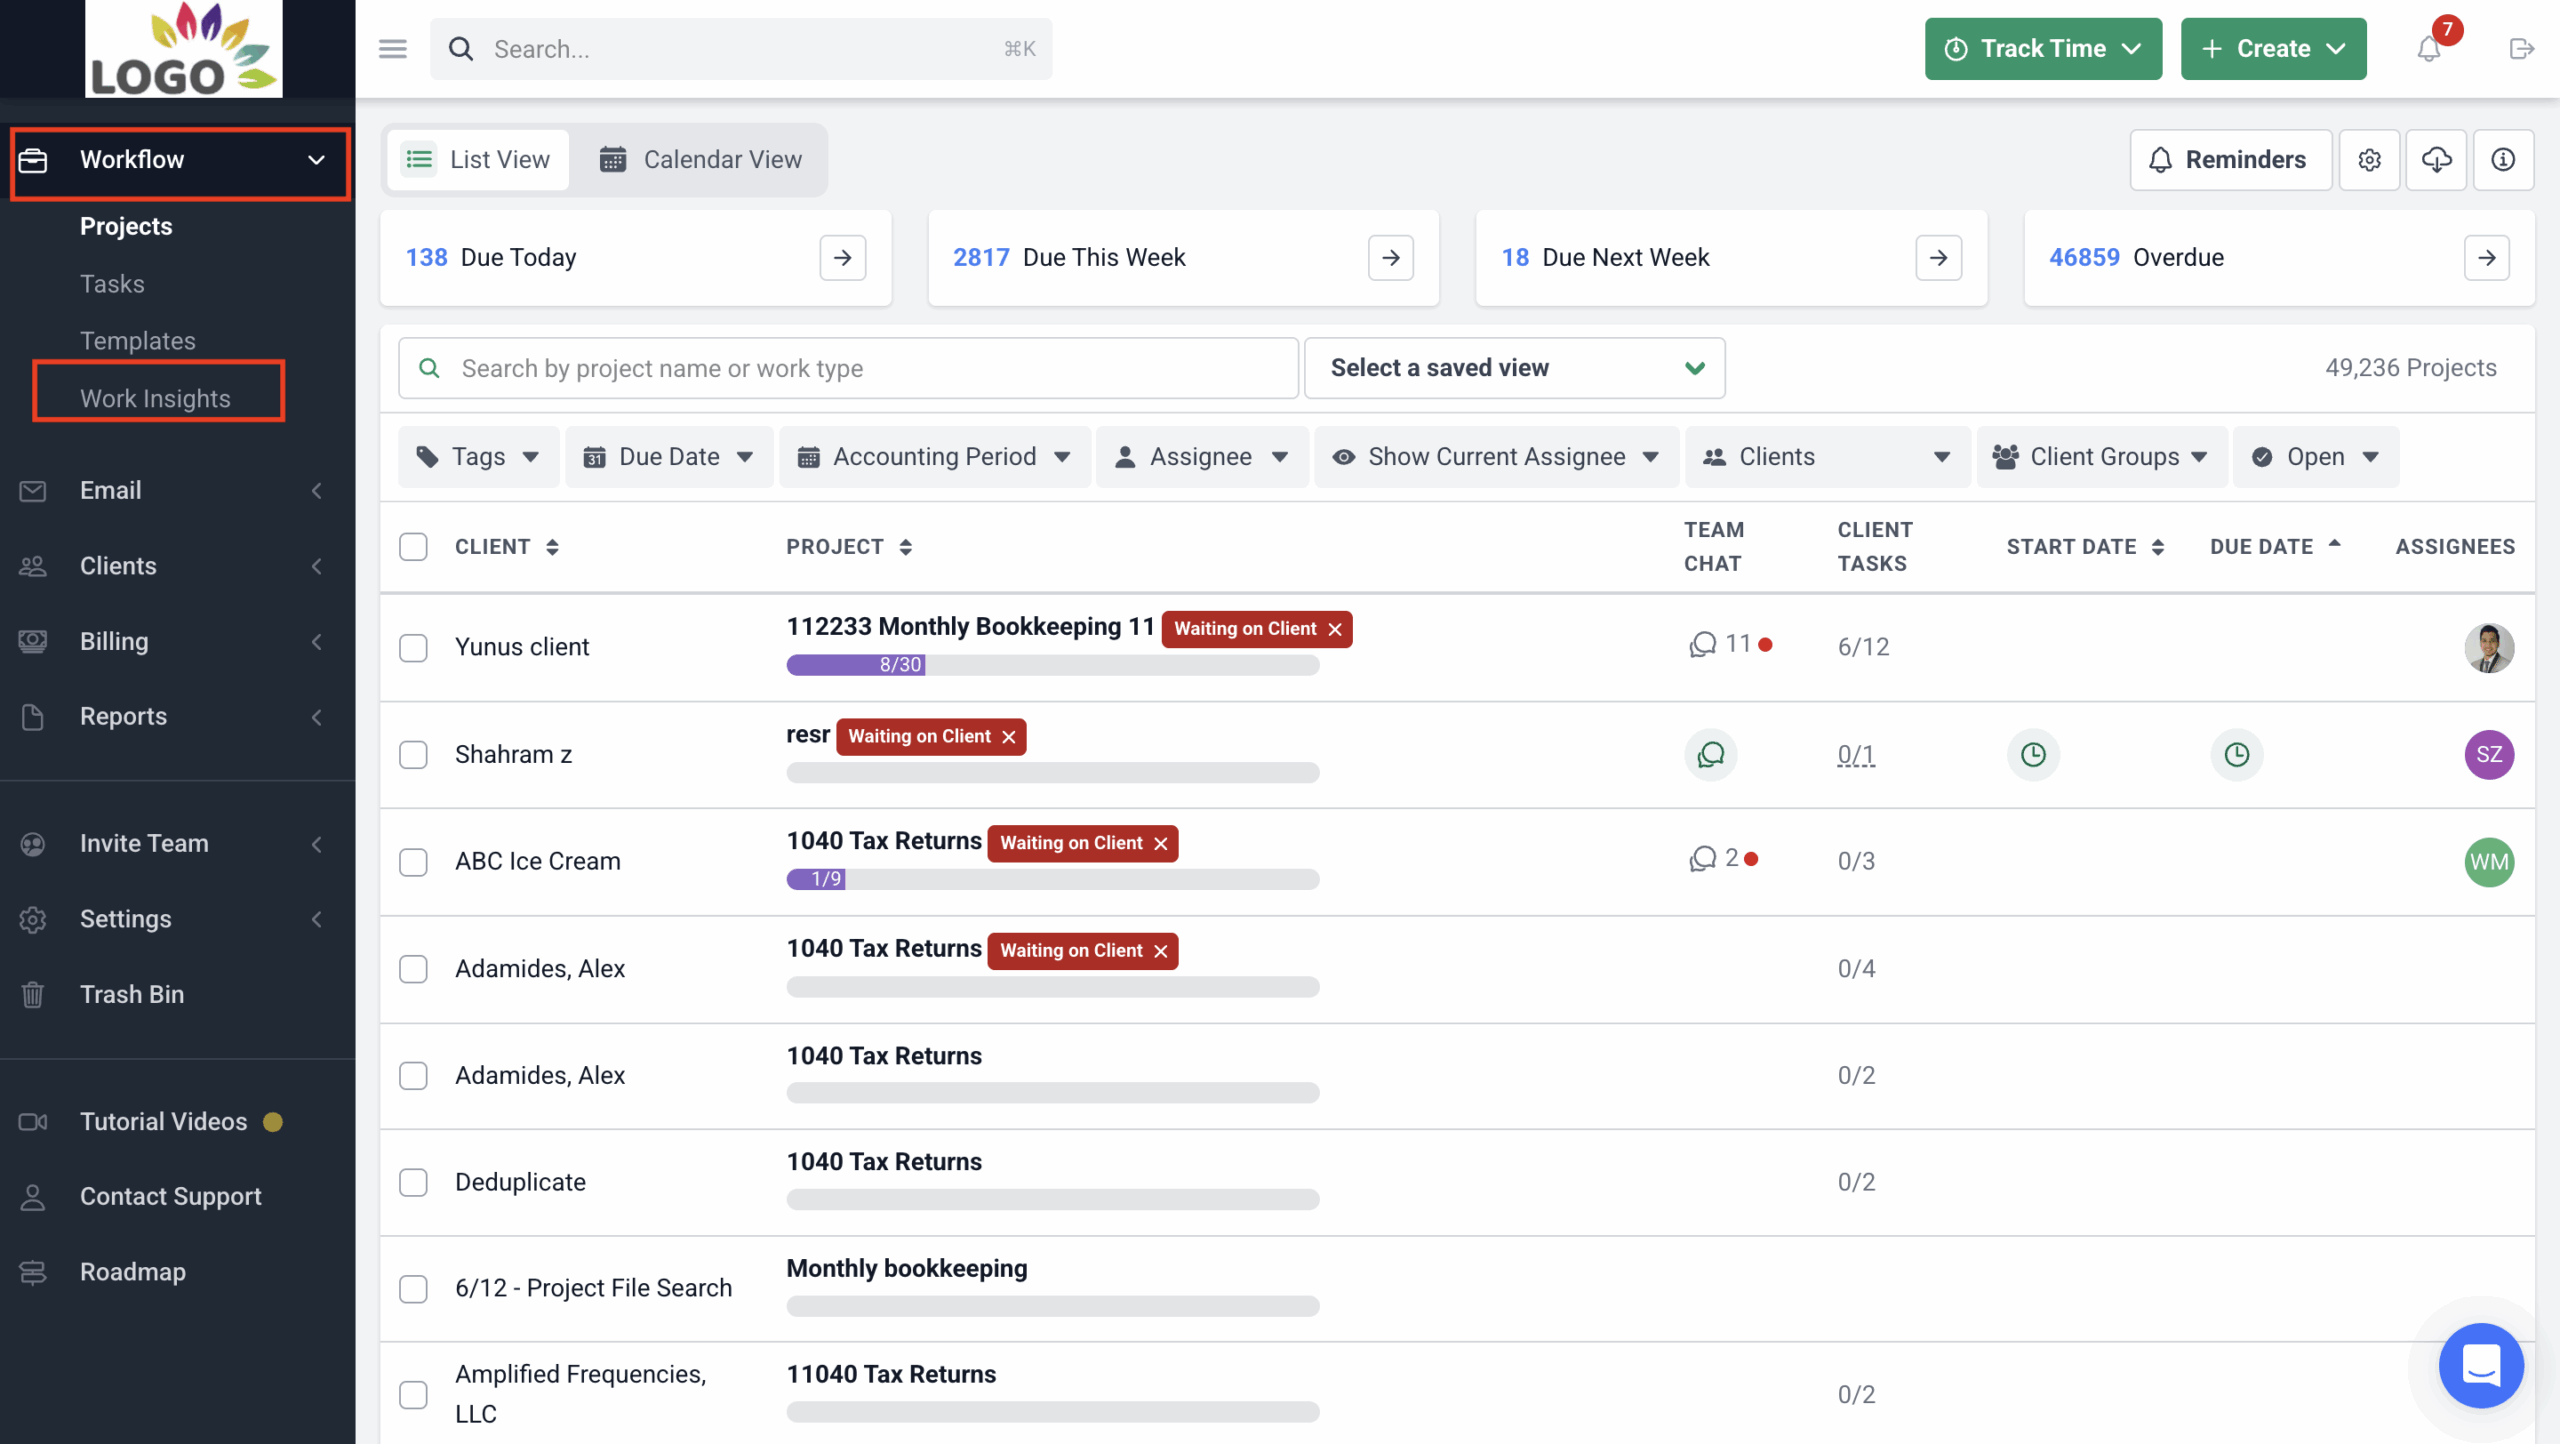
Step 1: Access the Workflow tab from the sidebar.
Step 2: Click on Work Insights
Dive into the Work Insights Report
Client Accountability Reports
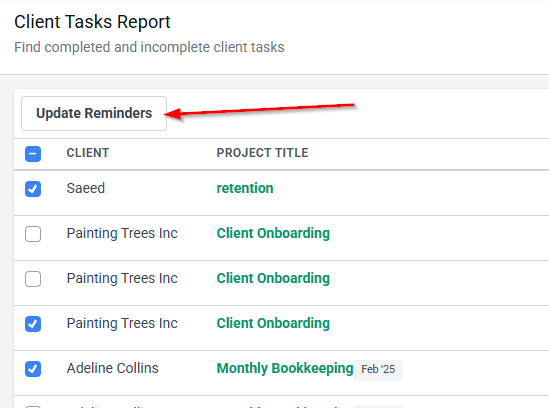
5. Client Tasks Report
Ever had a project stall because a client didn’t send in the information you needed?
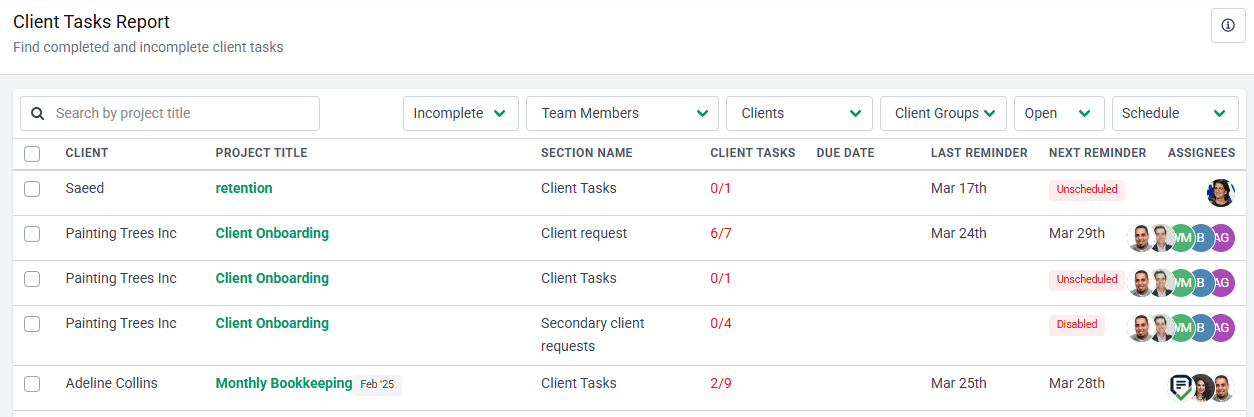
The Client Tasks Report helps you stay on top of all client-assigned tasks by showing their current status—so you always know who’s on track and who needs a nudge.
This report makes it easier to keep projects moving forward by holding clients accountable for their part in the process.
With the Client Tasks Report, you can:
- View all projects that include client-assigned tasks
- Quickly spot which tasks are still pending or overdue
- Filter by team member, client, or workflow to narrow your view
- Click on any project title to go directly to the project and review client requests
- Bulk update reminder settings to control how often clients receive notifications
Whether you need to follow up on incomplete tasks or simply get a status check, this report saves time and improves client collaboration.
How to Access This Report:
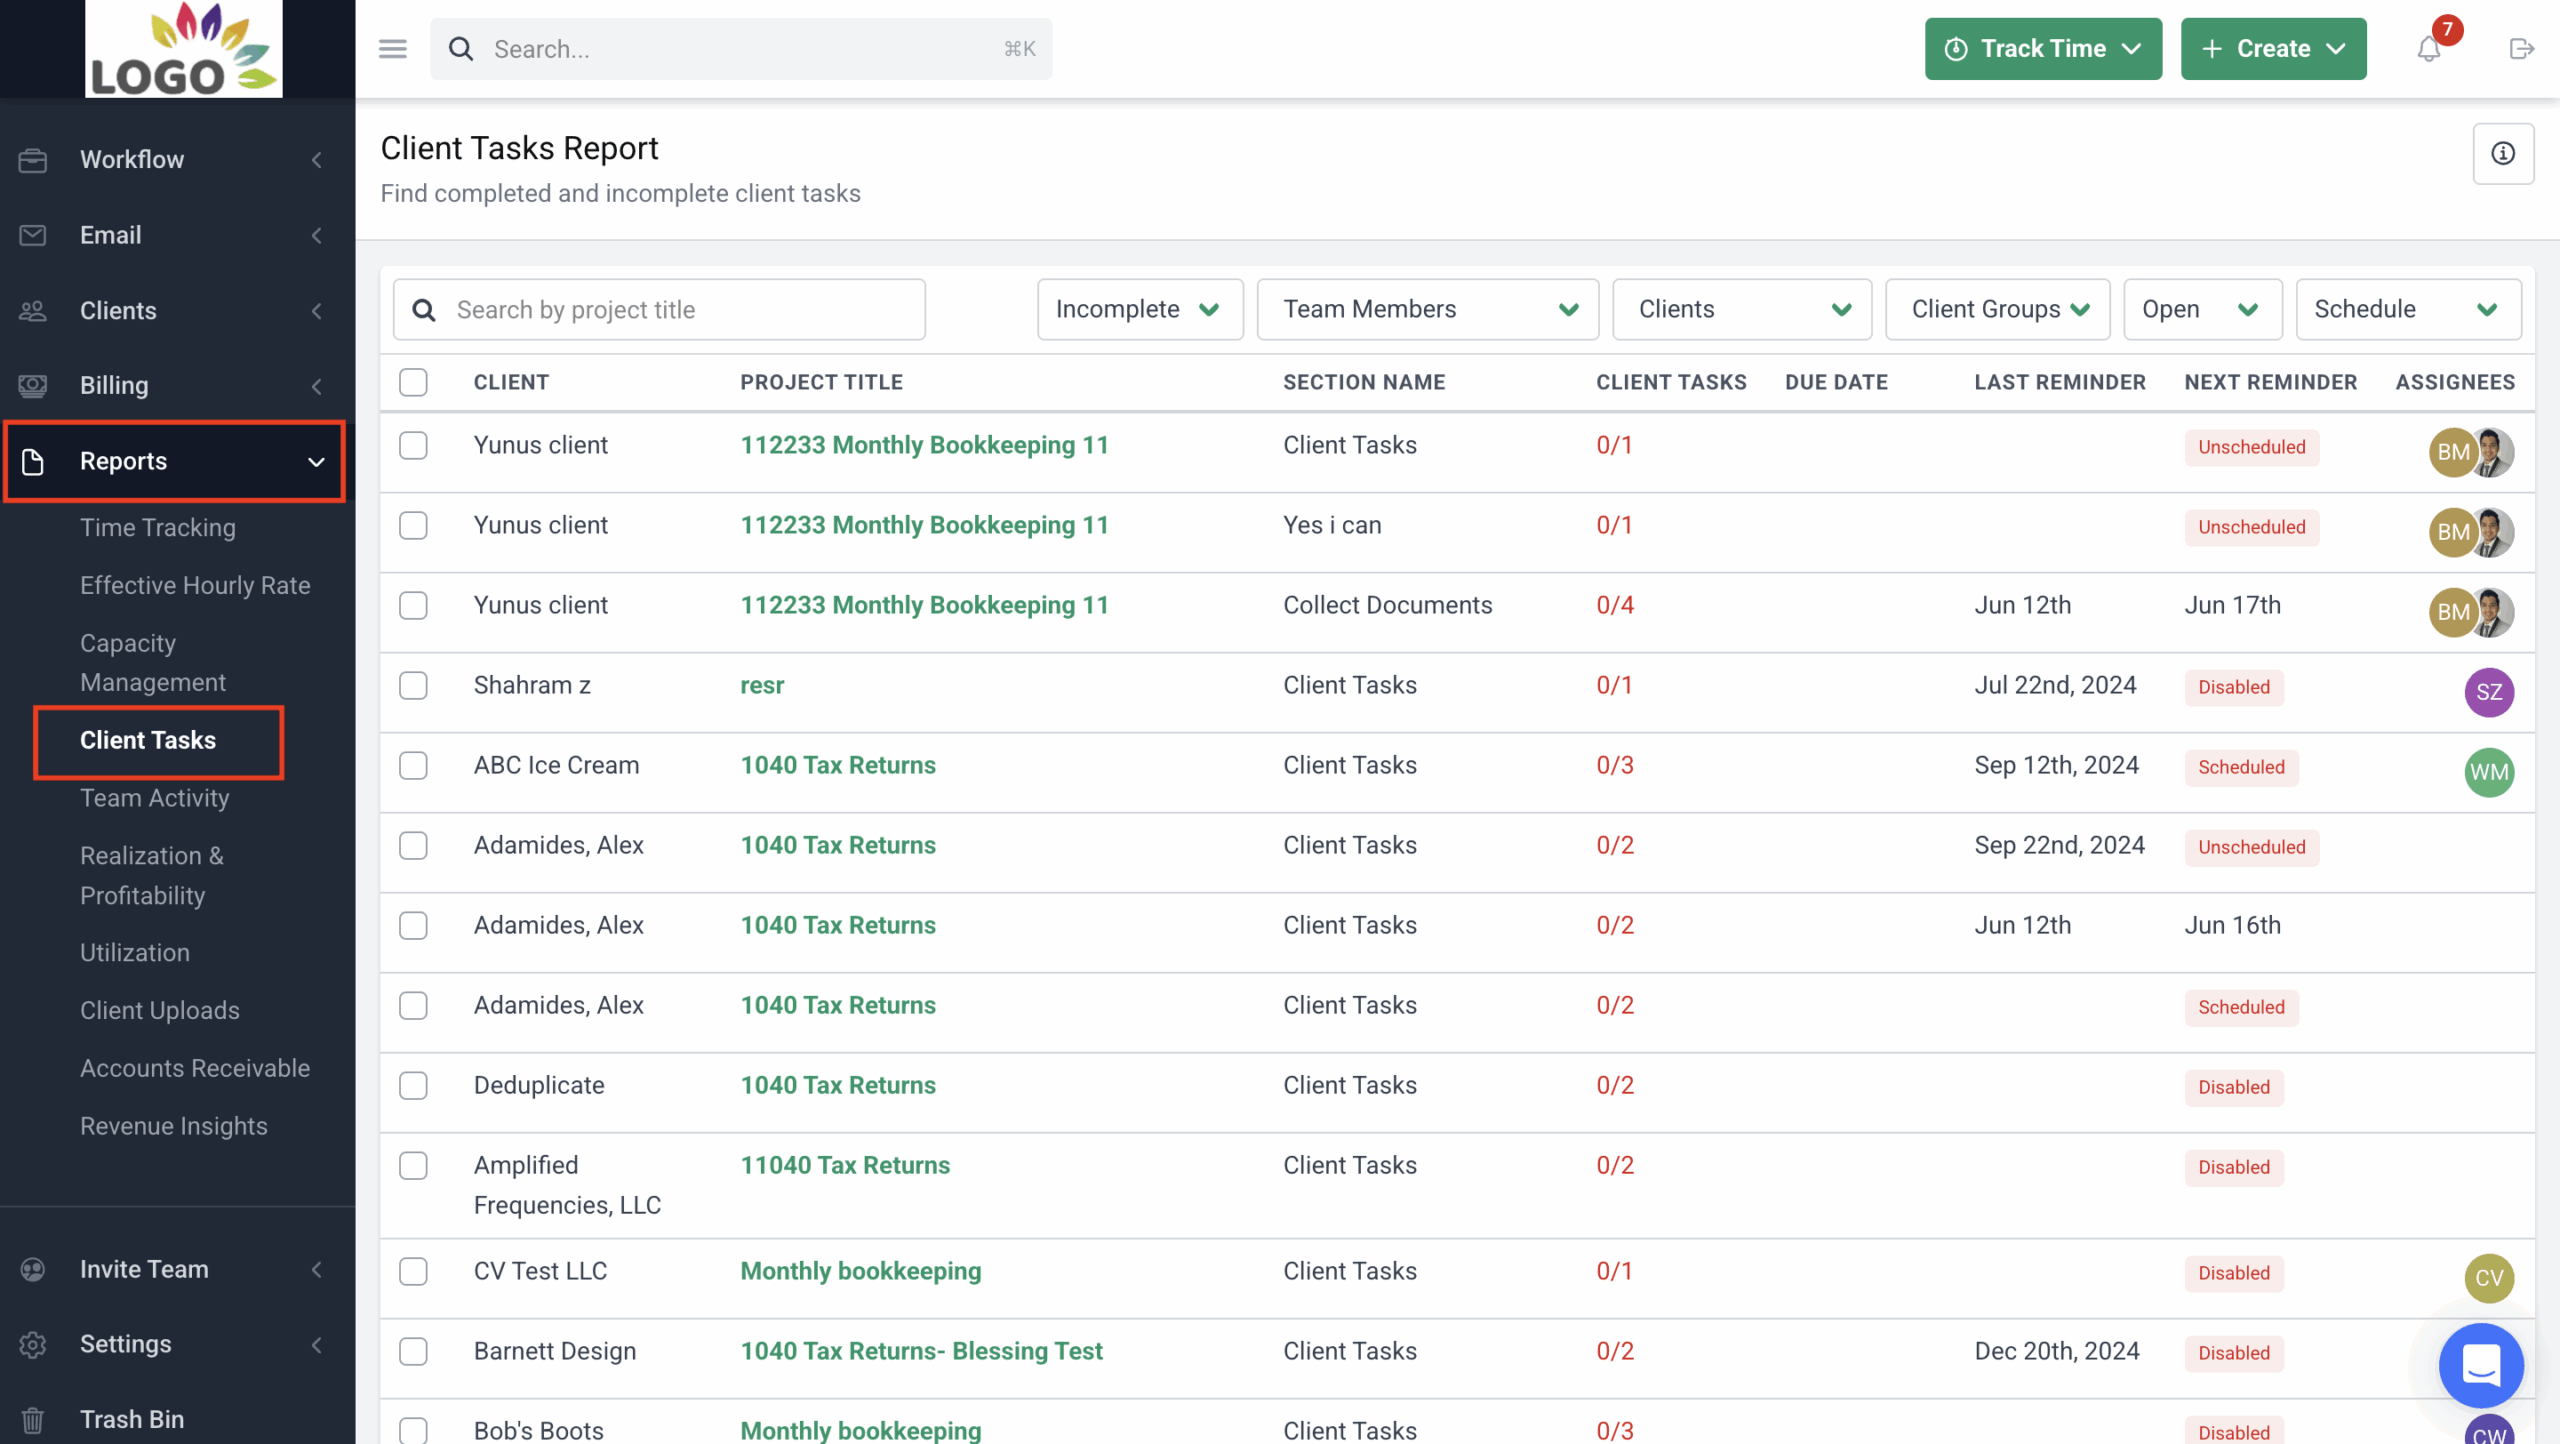
Step 1: From the Financial Cents dashboard, click on the Reports tab at the sidebar by the left.
Step 2: Click Utilization from the list of reports.
Learn more about the Client Tasks Report
6. Client Uploads Report
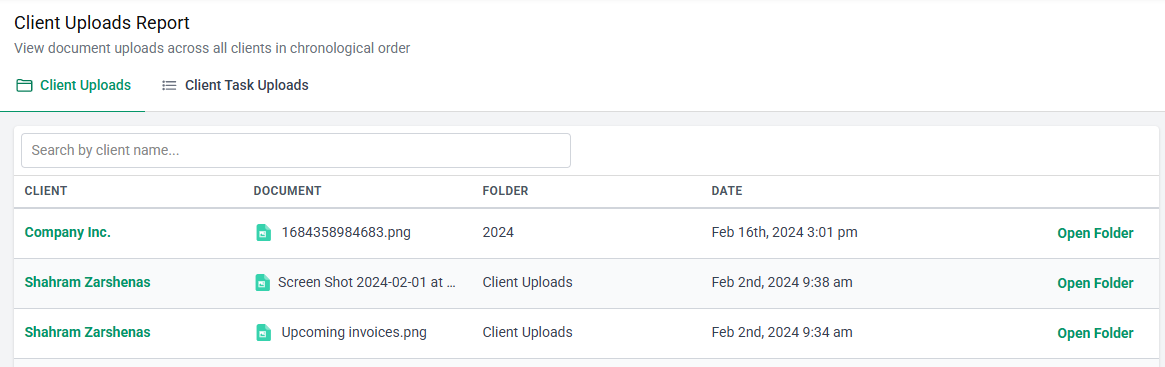
The Client Uploads Report makes it easy to track which files your clients have sent and what’s still outstanding. This report gives you full visibility into document submissions, helping you stay organized and on schedule.
Use it to:
- Track document uploads
- Access uploaded documents in just a few clicks
- Stay on top of deadlines
- Keep your client accountable
Whether files are uploaded through the Client Files section or attached to a Client Task within a project, this report centralizes all your uploads in one place. It saves your team hours of document wrangling—and helps ensure nothing falls through the cracks.
How to Access This Report:
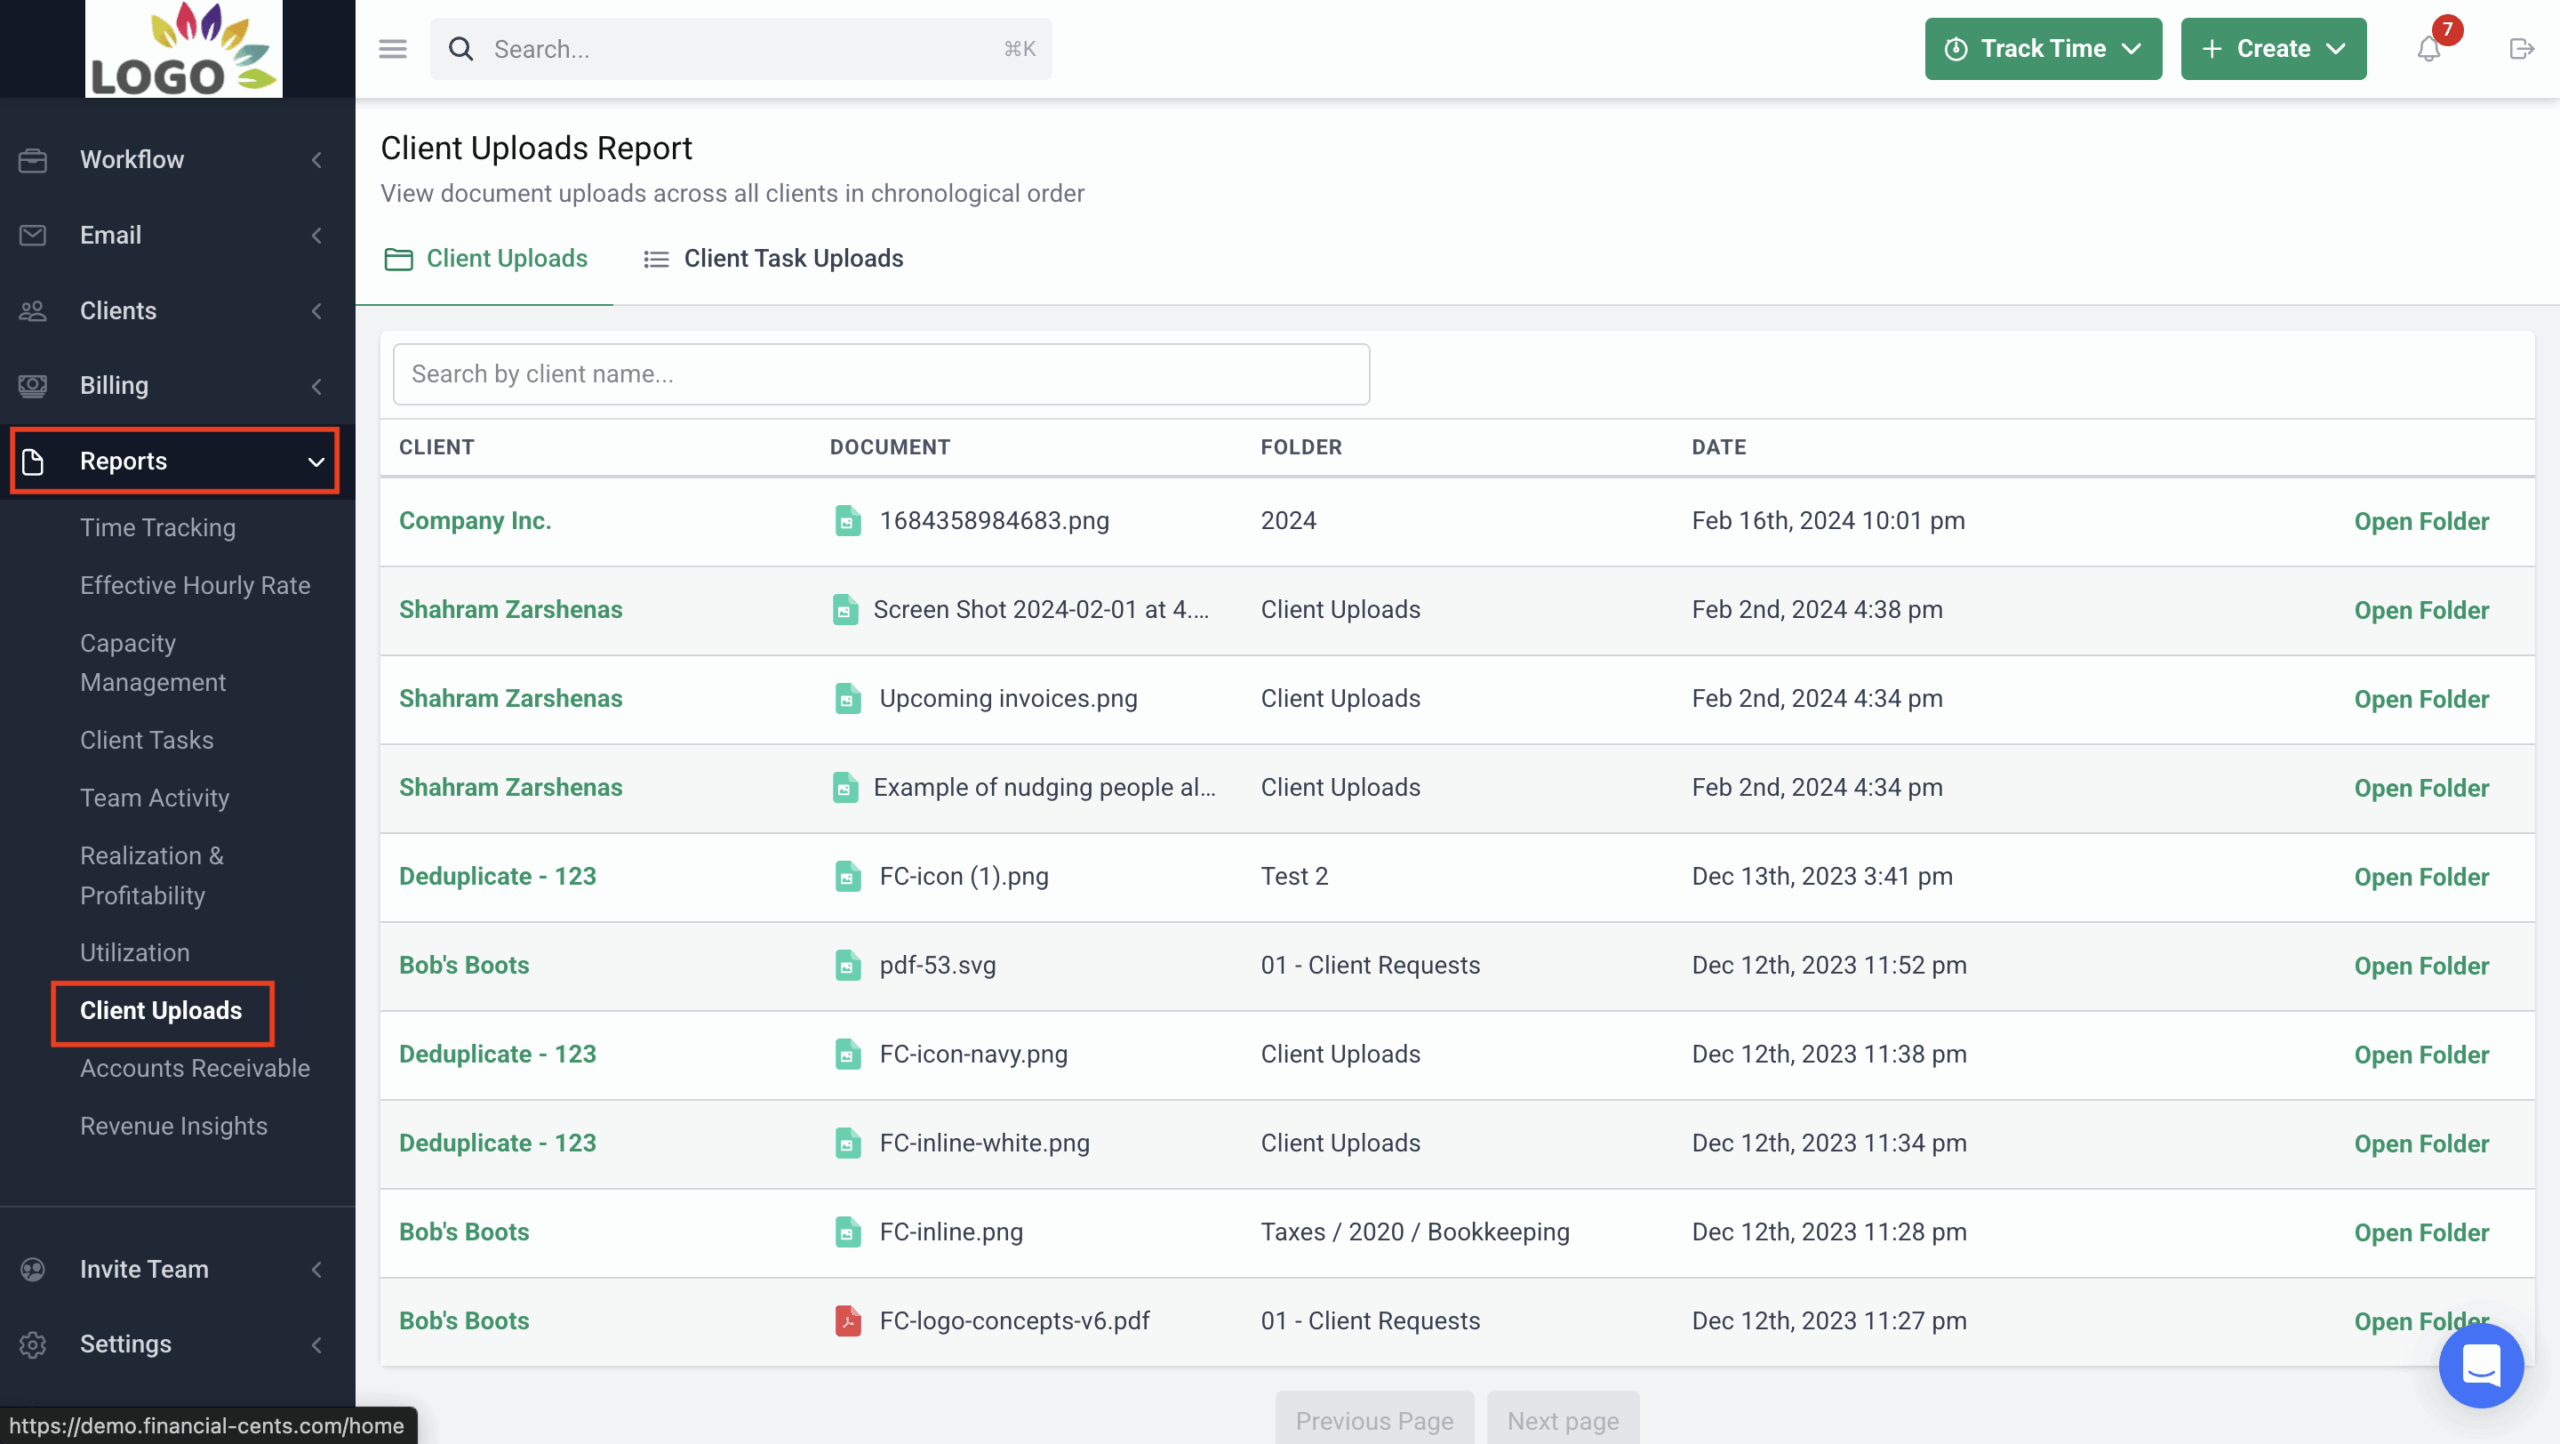
Step 1: From the Financial Cents dashboard, click on the Reports tab at the sidebar by the left.
Step 2: Click Client Uploads from the list of reports.
Learn more about the Client Uploads Report
Financial & Billing Performance
7. Revenue Insights Report
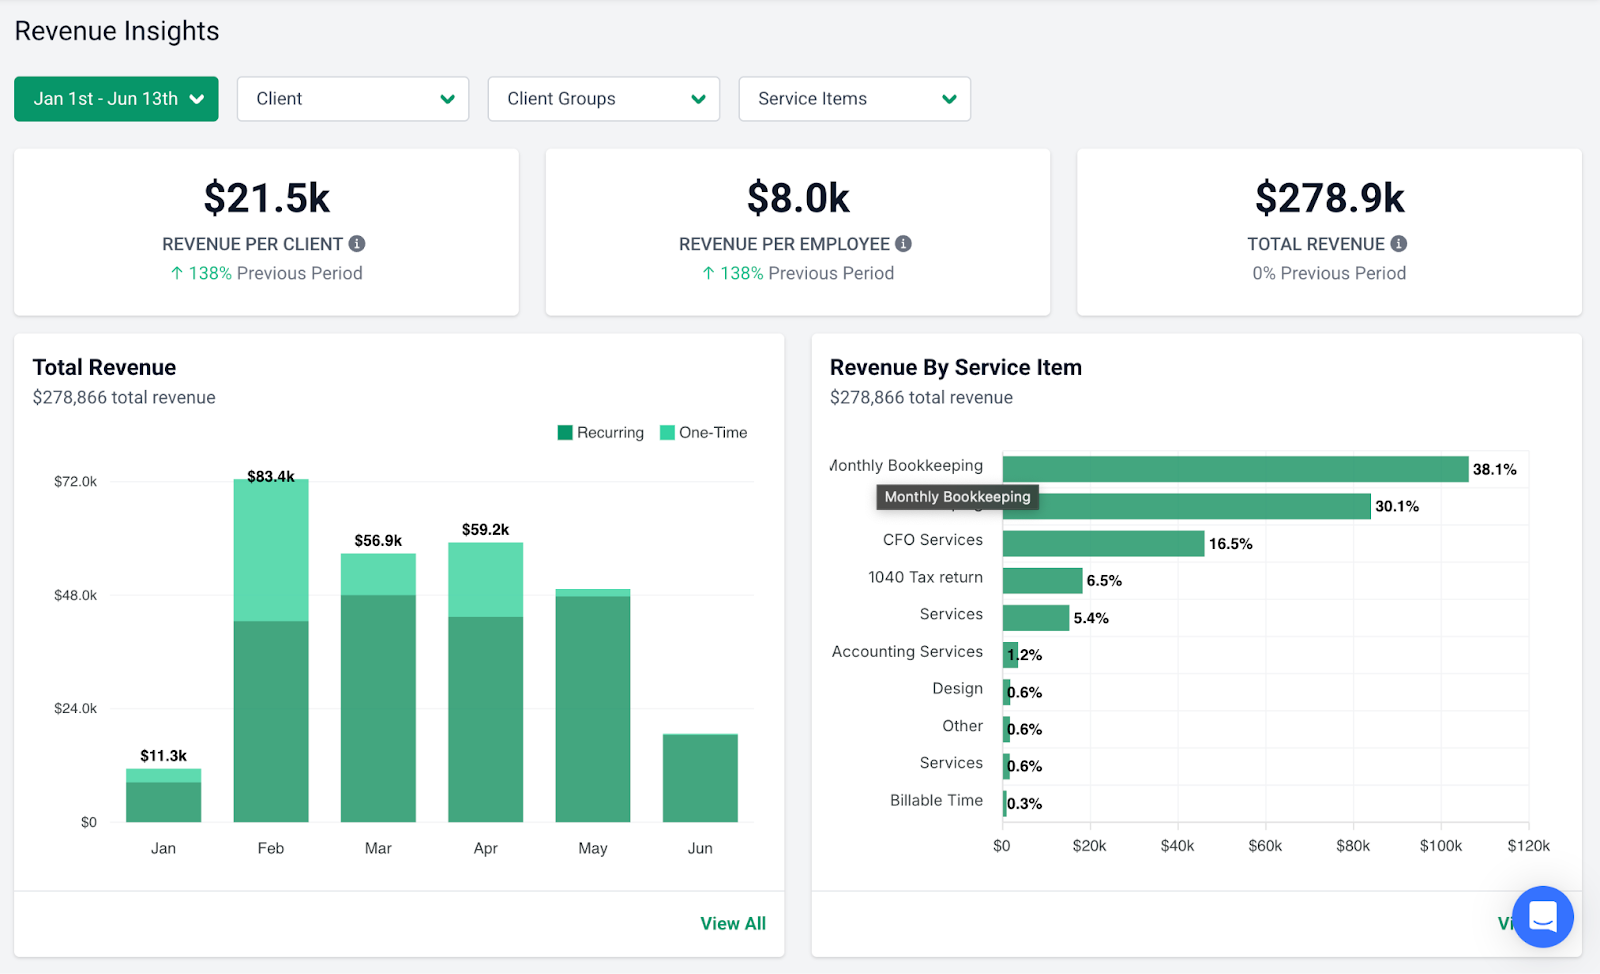
Curious which clients, services, or activities are driving your firm’s revenue?
The Revenue Insights Report gives you a detailed breakdown of your income across clients, service types, and time periods, so you can double down on what’s profitable and optimize what’s not.
Whether you’re shaping pricing strategies or targeting the right types of clients, this report puts the revenue data you need at your fingertips.
Use it to:
- Identify your most profitable clients
- Spot low-revenue areas that may need pricing or process adjustments
- Compare current revenue to past periods for performance tracking
- Make informed decisions around hiring, pricing, and business growth
Note: You must invoice through Financial Cents to access this report.
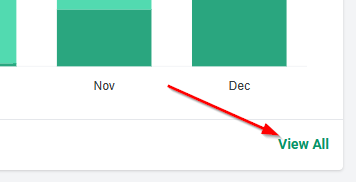
You can get more insights by filtering by specific client(s), client group(s), or service item(s) to explore targeted insights. You can also click the “View all” for full detail. Each graph includes a “View All” option in the lower right corner—click it to get deeper visibility into the numbers driving the visualized data.
The Revenue Insights Report helps you cut through the noise, spotlight what’s working, and uncover opportunities to grow your bottom line.
How to Access This Report:
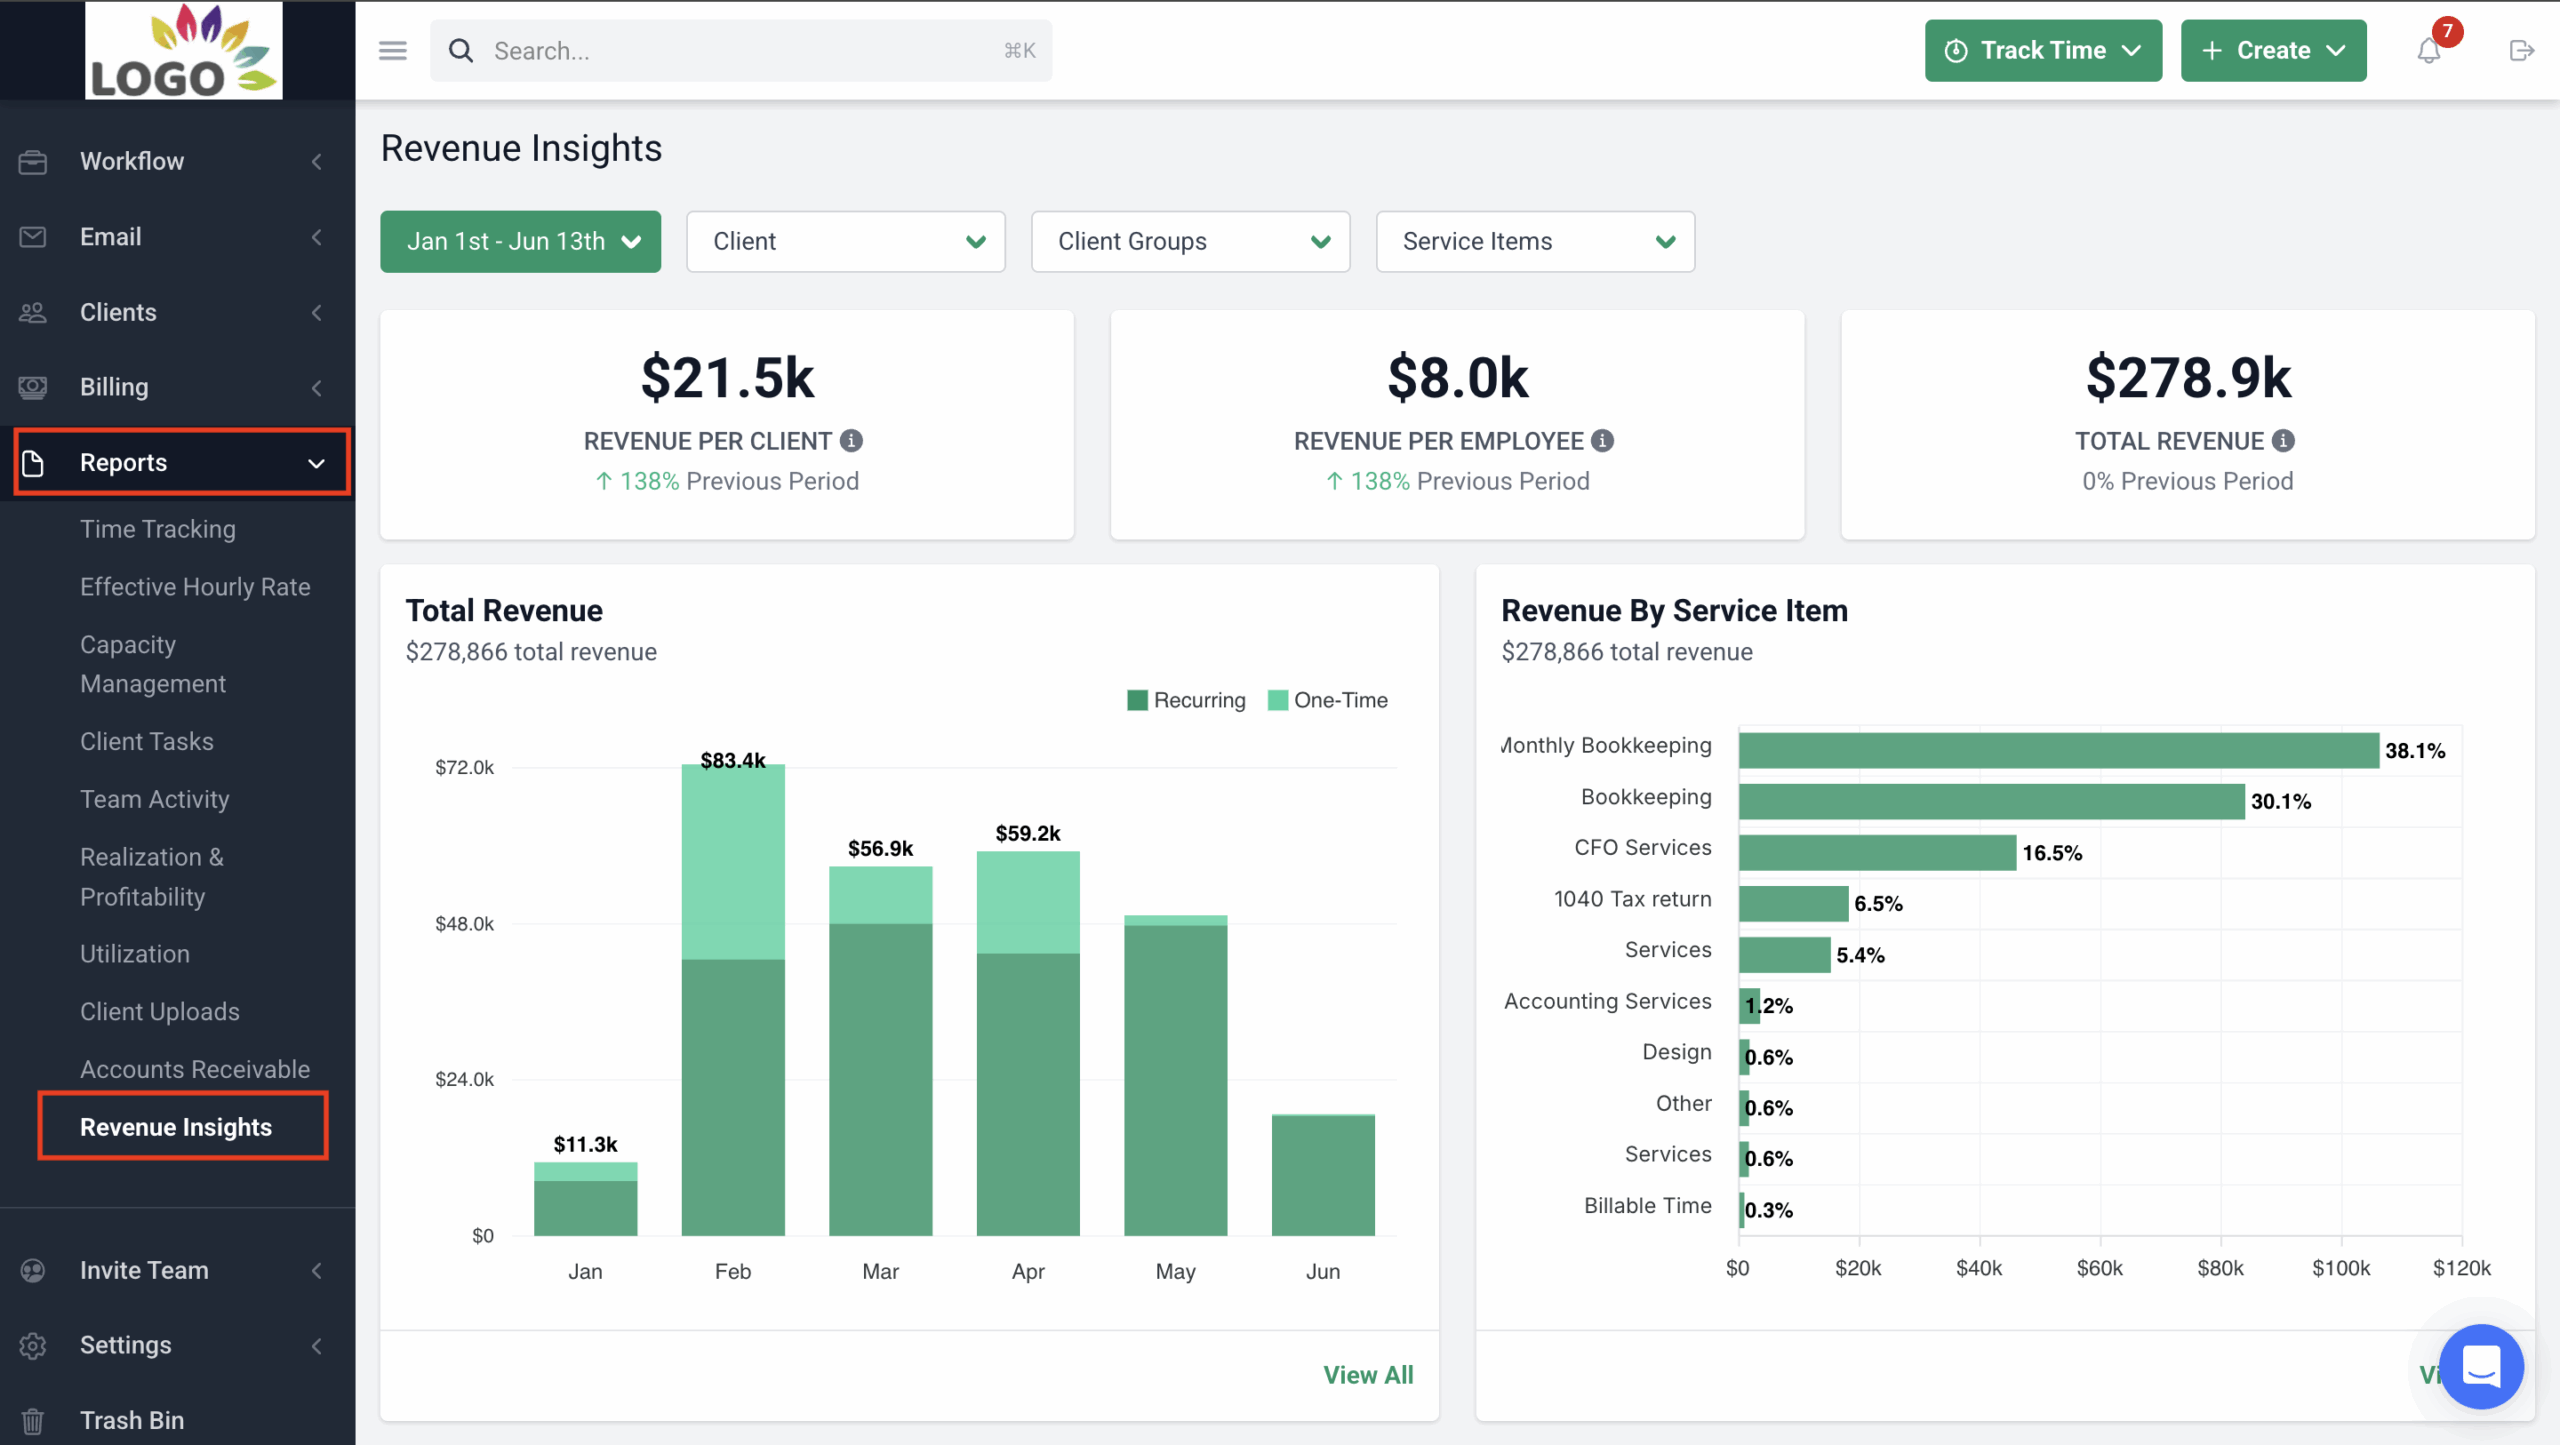
Step 1: From the Financial Cents dashboard, click on the Reports tab at the sidebar by the left.
Step 2: Click Revenue Insights from the list of reports.
Explore the Revenue Insights Report
8. Accounts Receivable Aging Report
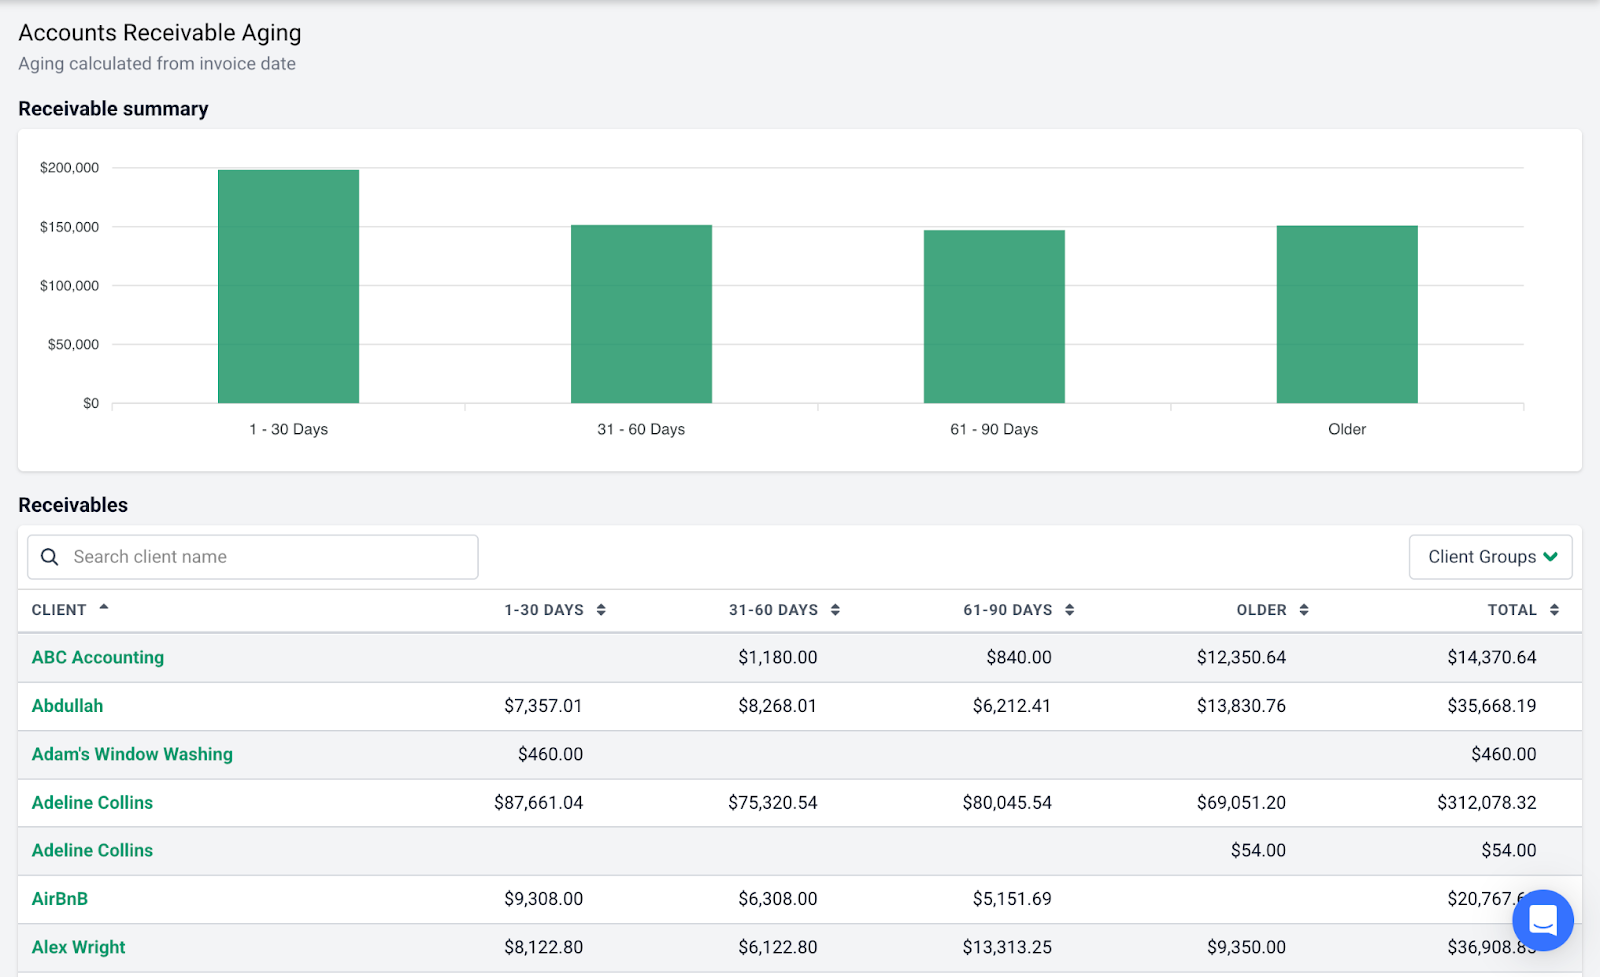
The Accounts Receivable Aging Report gives you a clear picture of which clients owe you money, how much they owe, and how long invoices have been overdue—so you can follow up faster and improve your cash flow.
You can see the data visually in both table and graph form for quick analysis.
Use it to:
- Track unpaid and overdue invoices
- Prioritize follow-ups with clients who owe the most
- Get paid faster and reduce outstanding balances
- Maintain healthy cash flow
Note: You must invoice through Financial Cents to access this report.
The report breaks down total outstanding balances, aging buckets (e.g., 0–30, 31–60, 61–90+ days overdue), unpaid invoices by client and overall firm-wide view and per-client details.
You can search by client name or filter by client group to narrow your view.
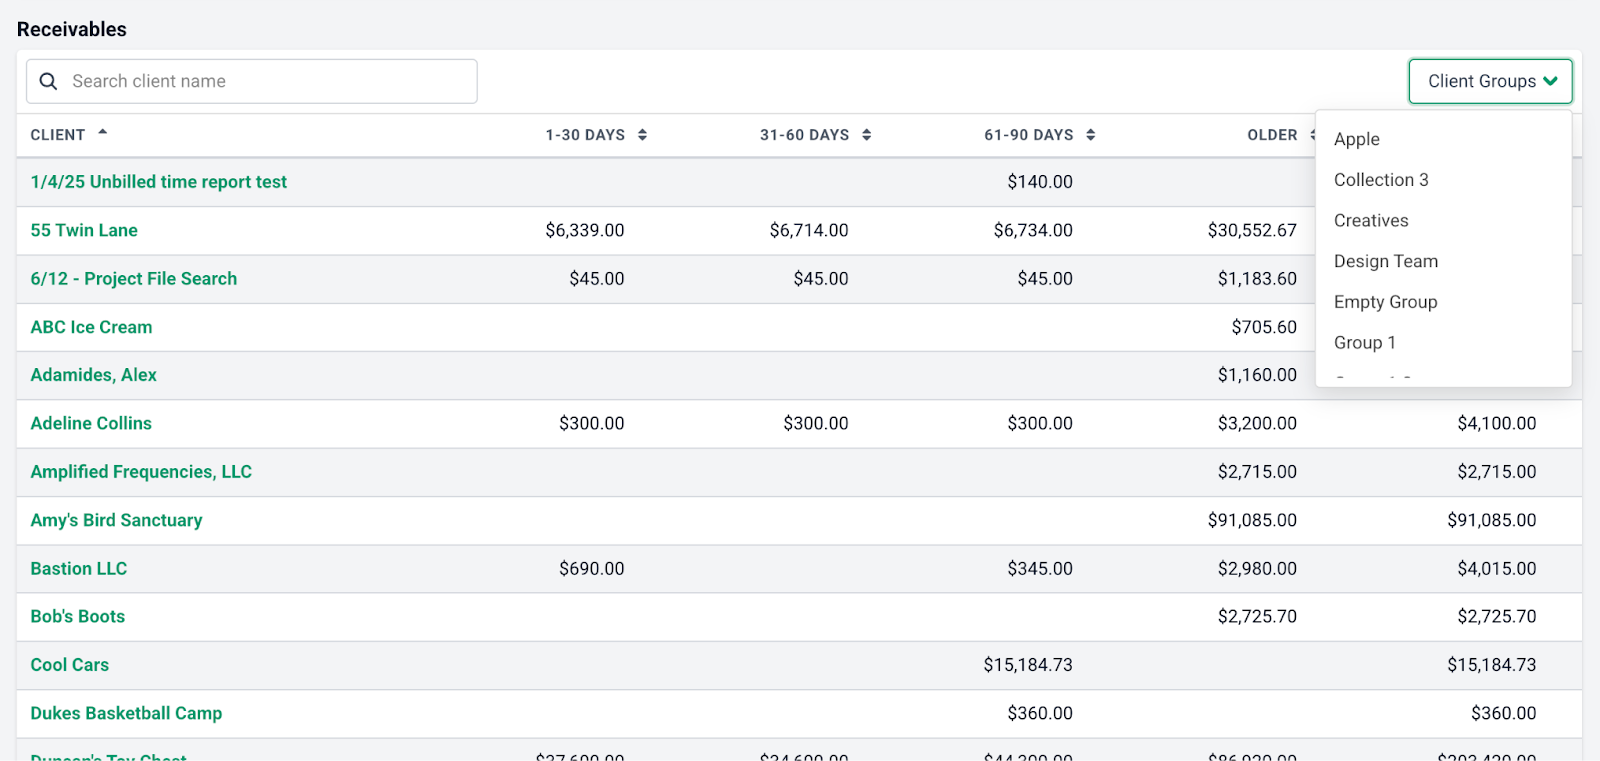
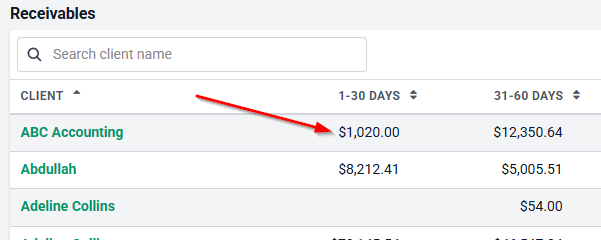
Click on any dollar amount to jump directly to that client’s Invoices page—where you can quickly view unpaid invoices and send payment reminders.
How to Access This Report:
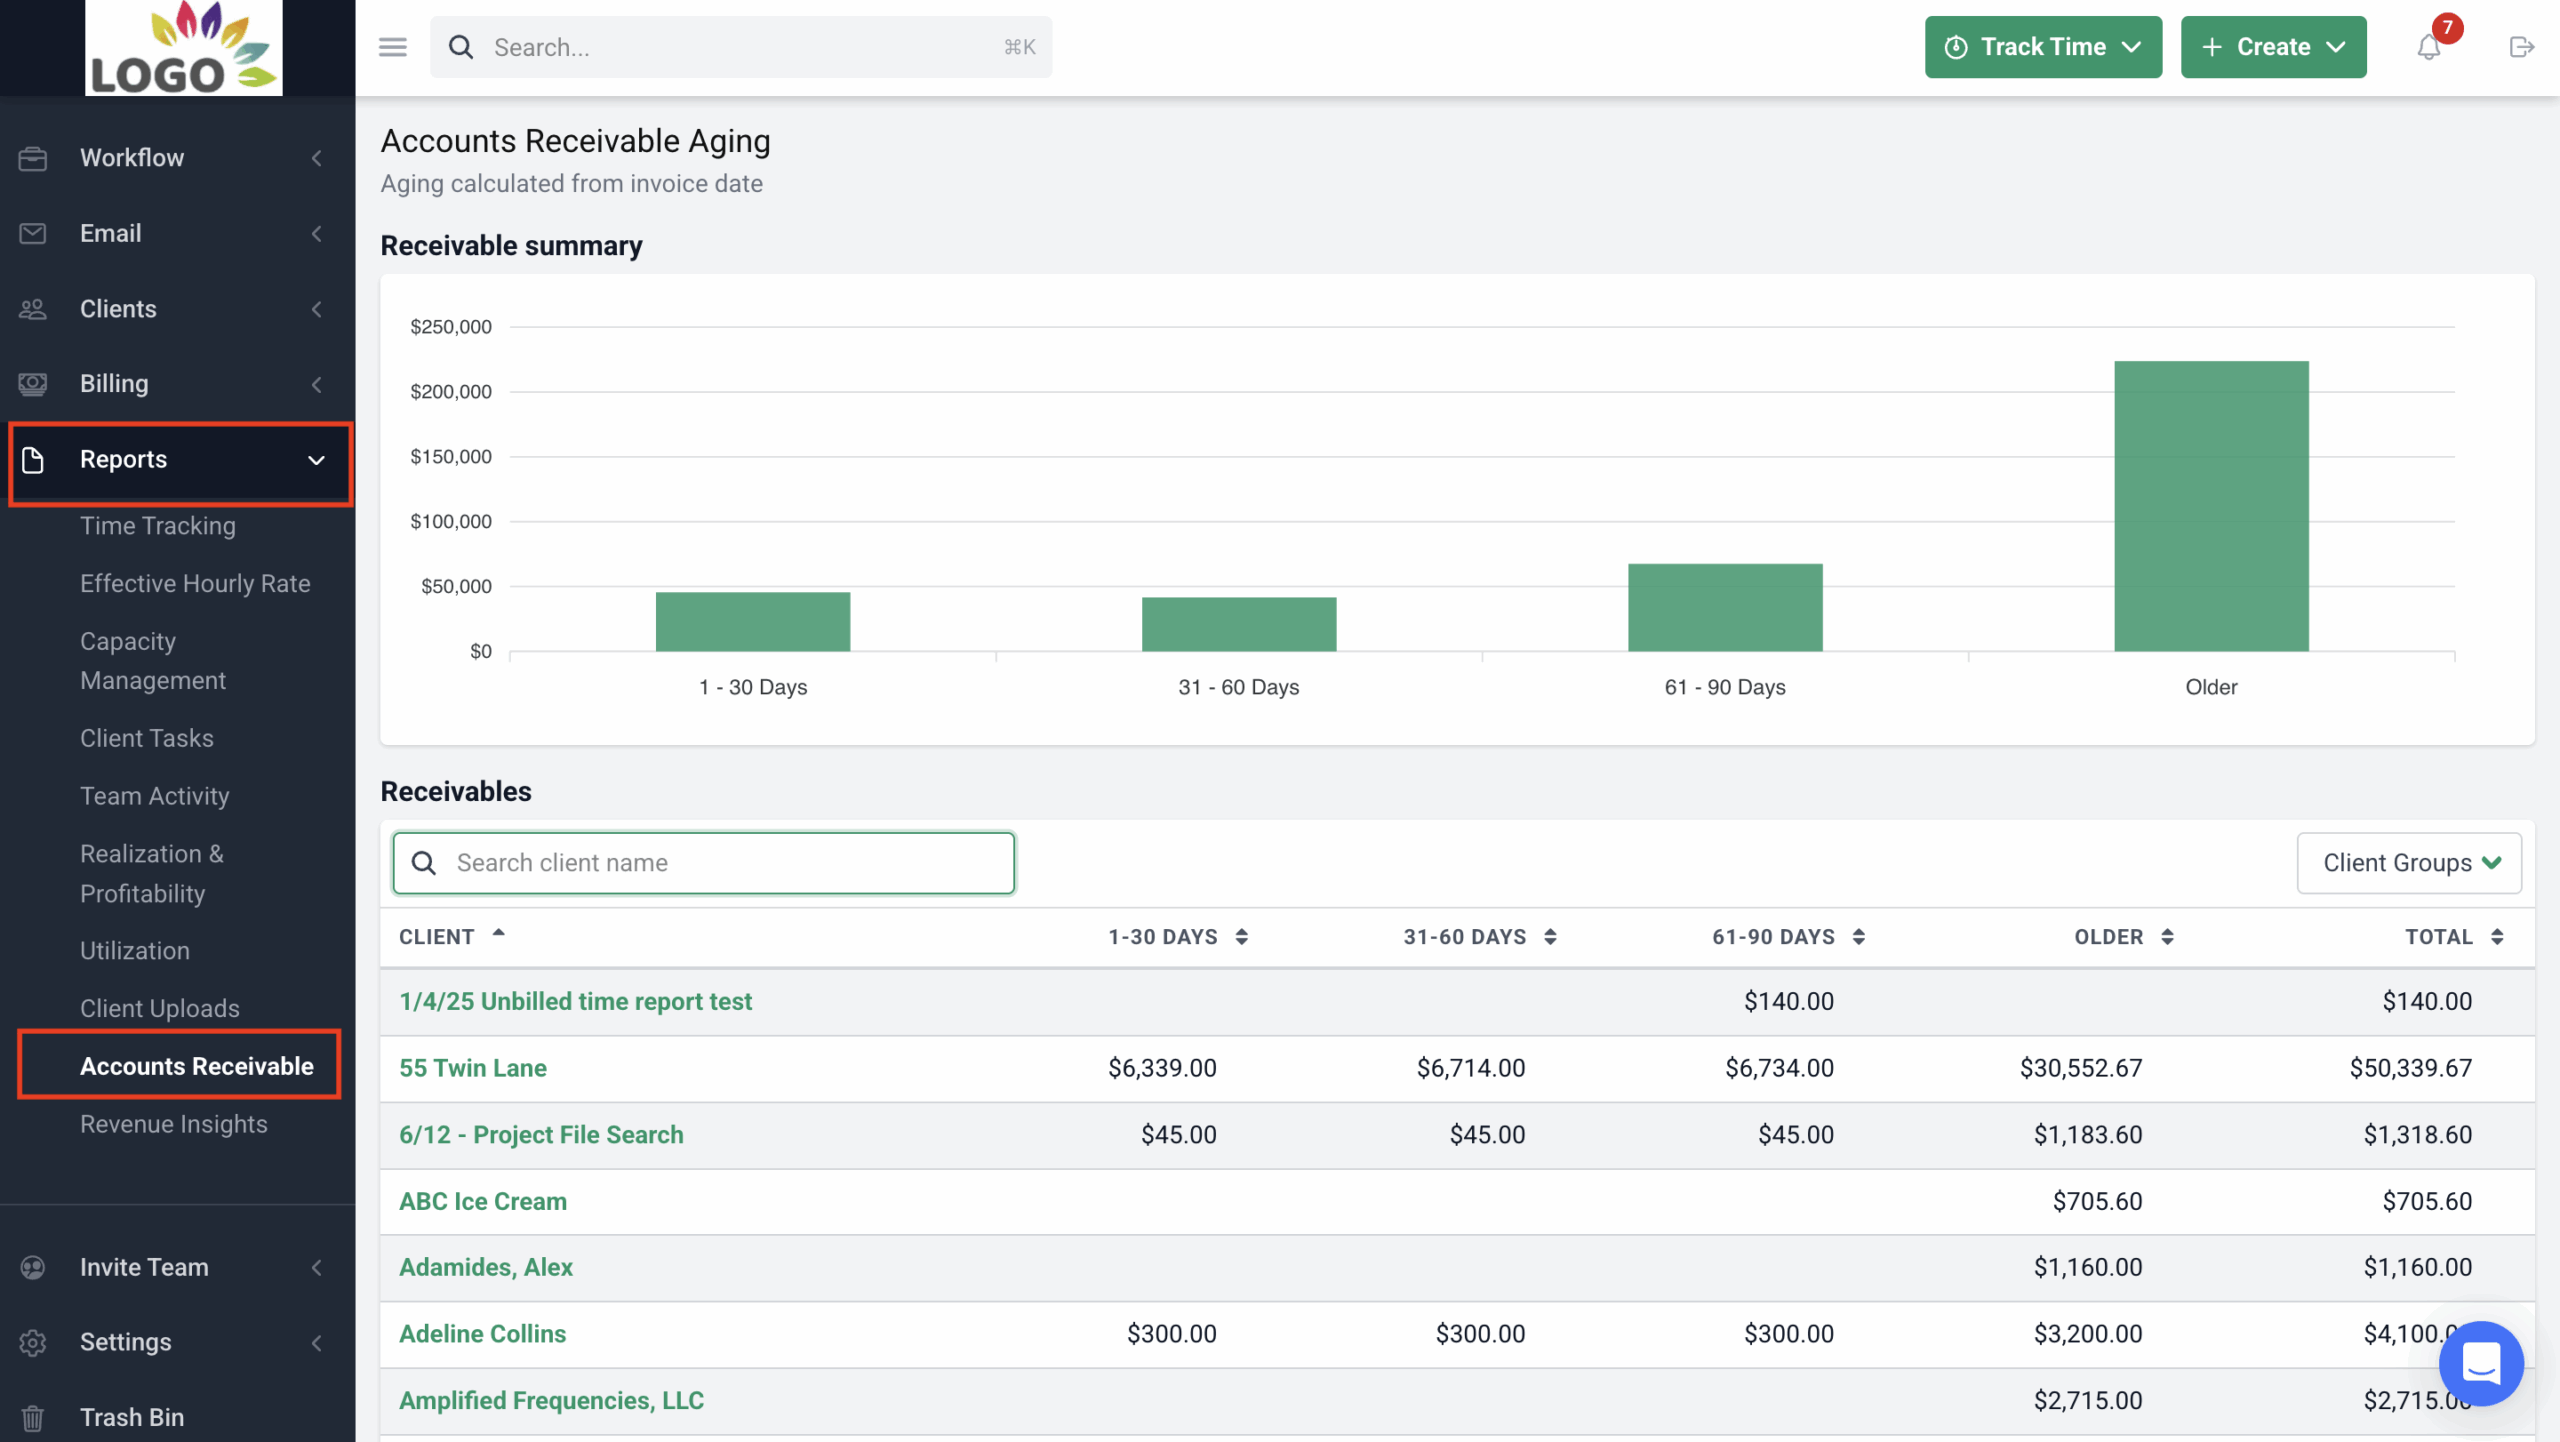
Step 1: From the Financial Cents dashboard, click on the Reports tab at the sidebar by the left.
Step 2: Click Accounts Receivable from the list of reports.
See the Accounts Receivable Aging Report
Take Control of Your Firm’s Performance
These new reporting features in Financial Cents are designed to give you complete visibility into your firm’s operations—from team performance and project health to client responsiveness and cash flow.
With all your key insights in one place, you can make informed decisions faster, manage your team more effectively, and drive real growth.
Ready to get started?
Log in to your Financial Cents account and explore the new reports under the Reports tab—or book a free demo or start a free trial to see them in action.
FAQs
Q: Where can I find all the new reports in Financial Cents?
A: All reports can be accessed by navigating to the Reports tab on the dashboard after you sign up for Financial Cent. The Work Insights Report, however, can be accessed by clicking on Workflow > Work Insights. Each report has its own section with filters to help you drill down into specific insights.
Q: Can I export these reports?
A: Yes, most reports allow you to export data as CSV files for further analysis or sharing.
Q: Who can access the reports in my team?
A: Permissions may vary depending on the user role. By default, Owners have access to all the reports. Owners can control which roles on the account (e.g. Admin, Member, or Contractor) can view the Utilization report by modifying the settings under Invite Team > User Permissions.
Q: Do these reports update in real time?
A: Yes, all reporting data is updated in real time as work is completed, time is tracked, or revenue is logged.
Q: Are these reports available on all pricing plans?
A: Yes, they are. You can access all the new advanced reporting features with any of our plans.


