
When you want to understand a business’s financial health, one of the first places to look is the Profit and Loss statement. Also known as the income statement, it’s one of the three core financial statements, alongside the Balance Sheet and Cash Flow Statement, that every accountant relies on.
The P&L gives a clear picture of how much money is coming in, how much is going out, and whether the business is operating at a profit or a loss. That makes it vital not only for tax filing but also for strategic planning, from managing costs to identifying growth opportunities.
Before diving in, let’s clarify the key elements you’ll take away: what a Profit and Loss statement is, why it matters, and how to read one with confidence.
What is a Profit and Loss Statement?
A Profit and Loss Statement (P&L) is a financial report that tracks a business’s revenues, expenses, and profits or losses over a set period, whether monthly, quarterly, or annually. Rather than being just a collection of figures, it lays out how much money came in, how much went out, and what remained at the end of the day.
The purpose of a P&L is to give you a structured view of business performance. It answers key questions like: Is the company generating enough revenue to cover its costs? Are expenses cutting too deeply into margins? Is the business on a profitable path, or is it drifting into loss?
Depending on the context, you may also see it referred to as an Income Statement, Statement of Earnings, or Statement of Operations. The names vary, but the role remains the same: to provide a clear and organized picture of how money flows through the business, enabling owners, accountants, and investors to make informed decisions.
Why Is a P&L Statement Important?
You already know a P&L tracks revenues, expenses, and profits or losses, but its real value comes from what you do with that information. Here’s why this statement is so important for any business:
Measures business performance
The P&L shows you, in black and white, whether operations are profitable. It helps you track performance over time and see if the business is moving in the right direction.
Identifies areas of overspending
The P&L makes it easier to identify costs that are eroding profits. Maybe advertising is running higher than expected, or overheads are creeping up. Either way, it gives you the data you need to course-correct.
Supports decision-making and forecasting
Want to expand, invest in new equipment, or streamline operations? The P&L provides the financial evidence to support those choices and project how future decisions might impact profitability.
Ensures tax reporting and compliance
The numbers from the P&L flow directly into the required tax documents. For example, sole proprietors in the U.S. rely on it to complete Schedule C (Profit or Loss from Business), and you can also review the official Schedule C instructions for guidance.
Provides insight for investors, lenders, and stakeholders
If you’re pitching to investors, applying for a loan, or reporting to a board, the P&L is one of the first documents people will want to see. It provides a snapshot of a business’s financial health and signals whether it is a safe investment.
The Key Components of a P&L Statement
To really understand a Profit and Loss Statement, it helps to break it down into its building blocks. Each section plays a role in showing how money flows through a business:
- Revenue: This is the total money earned from sales, services, or other income sources. It’s the “top line” number you’ll always hear about, because everything else flows from here.
- Cost of Goods Sold (COGS): These are the direct costs of producing or delivering your product or service. Think materials, production costs, or supplier expenses. For service-based businesses, it might include contractor fees or software licenses tied directly to delivering the service.
- Gross Profit: Subtract COGS from revenue, and you get gross profit. This indicates the amount of money remaining after accounting for overhead and other expenses. It’s a useful measure of how efficient the core business operations are.
- Operating Expenses: These are the everyday costs of running a business: rent, utilities, payroll, marketing, and administrative expenses. They keep the lights on but don’t tie directly to making or delivering products.
- Operating Income: Also known as operating profit, this is the amount remaining after deducting operating expenses from gross profit. It reflects how profitable the business is from its regular operations, excluding taxes and interest.
- Net Income: This is the “bottom line.” After subtracting interest, taxes, and any other non-operating expenses, you’re left with net income. This is the figure most people look at first to judge whether a business is truly profitable.
P&L Statement Example (A Simplified Case Study)
Let’s bring the concepts to life with a fictional example. Let’s say you’re reviewing the books for Sunny Café, a small neighborhood coffee shop. Here’s what their Profit and Loss Statement might look like for one month:
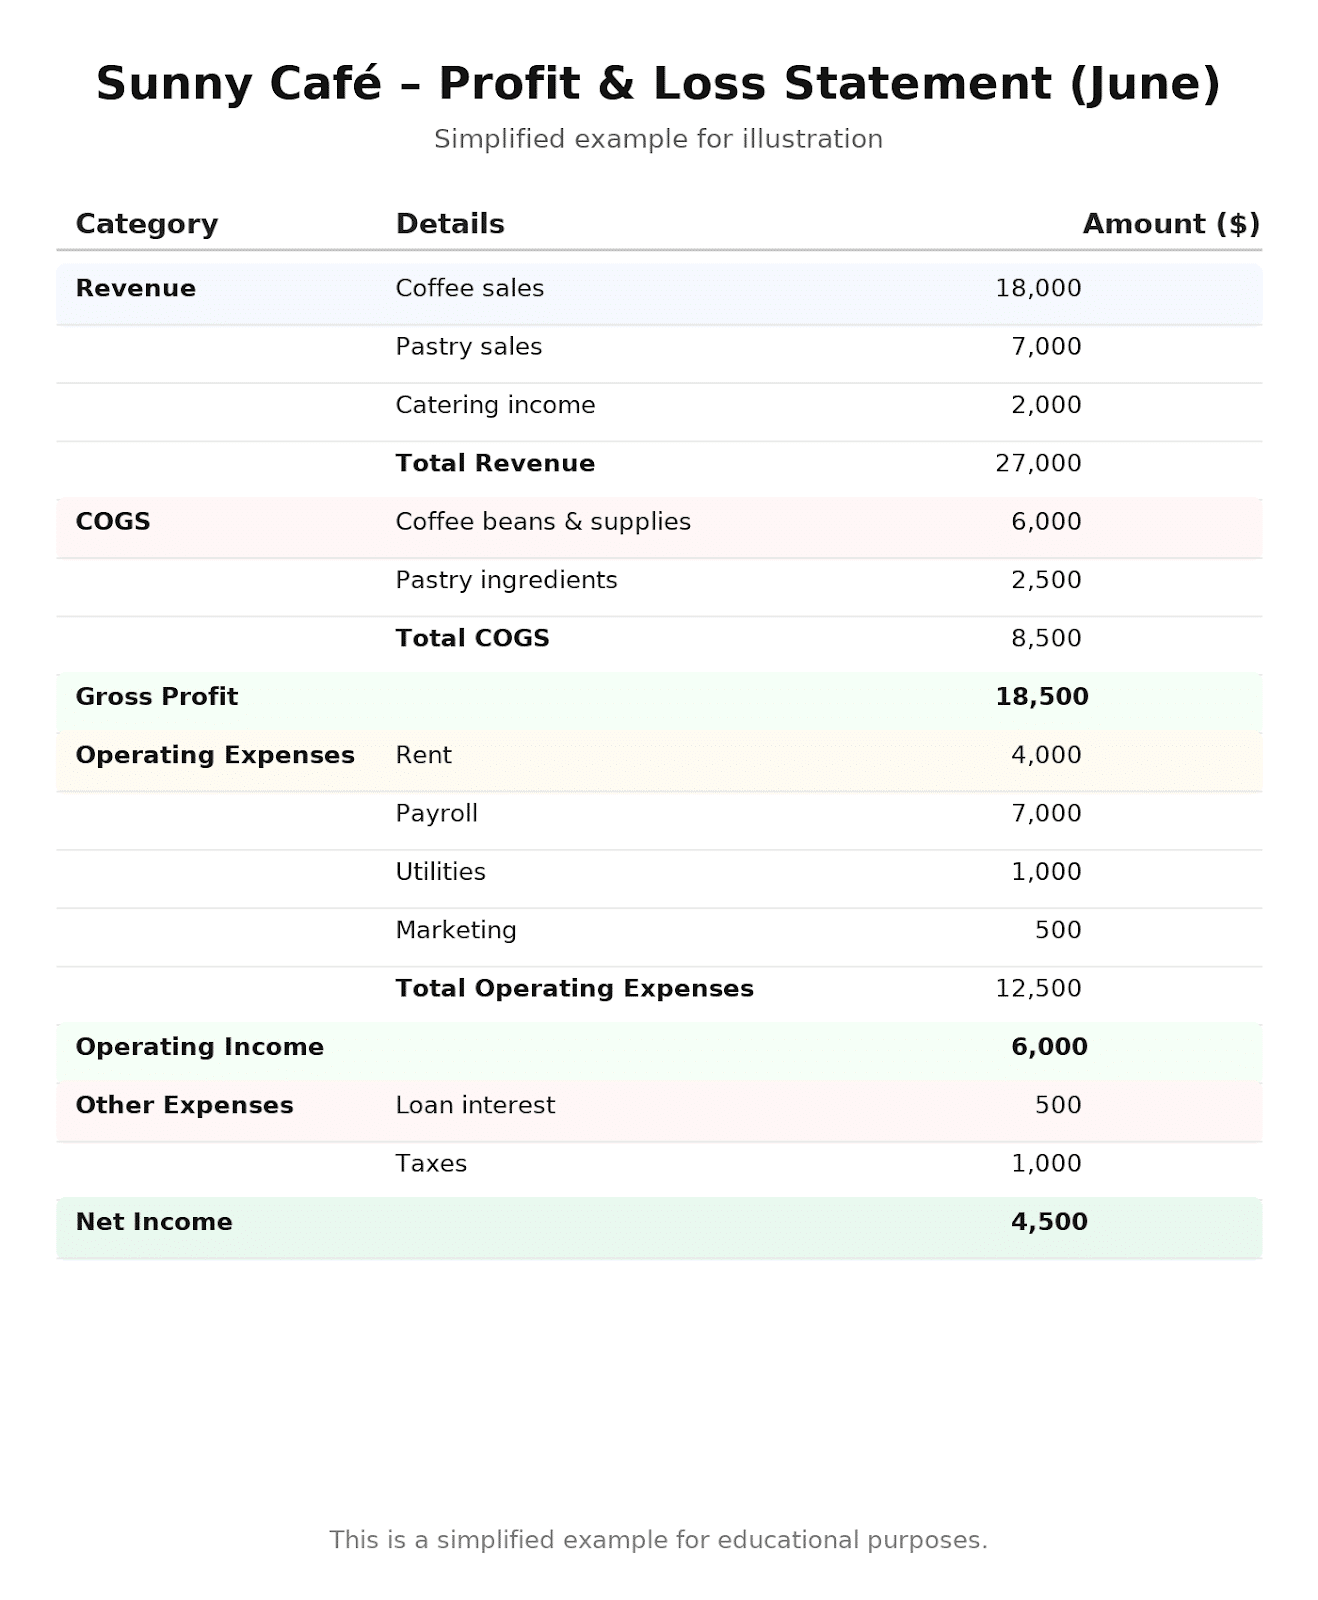
This simplified Profit and Loss Statement shows how revenue, expenses, and profits flow together in practice. Starting from total sales, you can see how costs (like ingredients, rent, and payroll) reduce gross profit, then operating expenses and other charges bring us down to the final net income. In this case, the café earned $4,500 in net income for June, a straightforward example of how the P&L tells the story of business performance.
Profit and Loss vs. Income Statement
You might hear people use the terms Profit and Loss Statement and Income Statement as if they’re two different reports. In reality, they’re the same thing. The difference lies in the terminology.
In some regions and industries, the term “Income Statement” is more commonly used. Elsewhere, especially in smaller businesses or accounting circles, you’ll often hear “Profit and Loss Statement” (or P&L). You may even come across alternatives like “Statement of Earnings” or “Statement of Operations.”
So don’t worry if clients, colleagues, or software platforms use different names. Ultimately, they all refer to the same financial report.
How to Prepare a Profit and Loss Statement
Creating a P&L may sound intimidating at first, but when you break it down, it’s really a step-by-step process. Here’s how you can do it:
Step 1: Gather financial data
Begin with the raw numbers. Pull together your sales records, invoices, receipts, bank statements, and any other financial documents that show income and expenses. The more accurate and complete your data, the more reliable your P&L will be.
Step 2: Categorize income and expenses
Next, organize your financial data into meaningful groups. Revenue can include product sales, service fees, or other income streams. Expenses should be broken down into categories like rent, payroll, utilities, supplies, and marketing. Also, this is where your chart of accounts comes into play as an accountant, keeping things tidy and consistent so the numbers make sense at a glance.
Step 3: Calculate gross profit
From your total revenue, subtract the Cost of Goods Sold (COGS), the direct costs of producing or delivering your goods and services. This gives you gross profit, which shows how efficiently the business turns sales into money before overhead comes into play. For example, if a bakery sells $20,000 worth of bread and pastries but spends $8,000 on flour, sugar, and other ingredients, its gross profit is $12,000.
Step 4: Subtract operating expenses
Now, take the gross profit and deduct the ongoing costs of running the business, including salaries, rent, utilities, insurance, marketing, and administrative expenses. This step reveals how profitable the business is from its core operations. Using our bakery example: $12,000 gross profit – $9,000 in operating expenses = $3,000 in operating income.
Step 5: Arrive at net profit (or loss)
Finally, account for any expenses outside of day-to-day operations, such as loan interest, taxes, or one-time expenses. Subtracting these from operating income leaves you with net profit (or loss). This is the true “bottom line” and the figure that lenders, investors, and owners look to first. If our bakery had $500 in loan interest and $700 in taxes, its net profit for the month would be $1,800.
How to Interpret a Profit and Loss Statement
Preparing a P&L is only half the job. The real value comes from interpreting the numbers and understanding what they say about the business. Here’s how to approach it:
Look for revenue trends
Start by reviewing revenue over time. Is it steadily growing, flatlining, or declining? A consistent upward trend suggests healthy demand, while stagnation or dips might signal issues with sales strategy, customer retention, or market conditions. For example, if a consulting firm’s revenue drops three quarters in a row, it’s worth asking whether pricing, client churn, or competition is the culprit.
Analyze gross margin and operating expenses
Gross margin (gross profit divided by revenue) tells you how efficiently the business turns sales into profit after covering production costs. A shrinking gross margin may indicate rising supplier prices or discounts that are cutting too deeply into revenue. Then look at operating expenses: are they reasonable compared to revenue, or creeping up faster than income? For instance, if marketing costs have doubled but revenue hasn’t budged, that’s a red flag for inefficiency.
Compare net income across periods
Net income is the bottom line, but its true value comes from comparison. Check results month over month, quarter over quarter, or year over year. A single profitable month might look great, but consistent profitability over several periods shows real stability. On the flip side, a sudden dip in net income could indicate a one-off cost (like equipment repairs) or a deeper operational issue.
Identify red flags
Finally, use the P&L to spot warning signs. Declining revenue, rising costs, shrinking margins, or frequent losses all deserve closer attention. For example, if payroll expenses grow much faster than sales, it could mean the business is overstaffed or not getting enough value from its hires. Identifying these red flags early gives you a chance to correct course before they turn into bigger problems.
Best Practices for Accounting Firms
As an accounting or bookkeeping firm, you’re not just preparing P&Ls, you’re using them as tools to guide your clients toward smarter financial decisions. To get the most out of every statement, here are some best practices worth adopting:
Standardize the chart of accounts
A consistent Chart of Accounts makes P&Ls easier to prepare, read, and compare across clients. When revenue and expense categories follow the same structure, you can quickly spot trends and benchmark performance. For example, if all your retail clients categorize “marketing” the same way, it’s much easier to show them how their spending stacks up against industry averages.
Reconcile accounts monthly
Accuracy is everything. By reconciling bank accounts, credit cards, and key ledgers every month, you ensure the P&L reflects reality, not guesswork. This habit prevents small errors from snowballing into bigger issues and helps maintain client trust. After all, it’s hard to advise a client with confidence if their revenue is overstated by a stray deposit.
Use comparative P&Ls
A single P&L gives you a snapshot in time, but a series of P&Ls reveals the bigger picture. Encourage clients to review month-over-month or year-over-year statements. This way, you can identify seasonal patterns, measure growth, or highlight areas where expenses are creeping up faster than revenue. For instance, showing a client that their payroll costs have risen 20% year-over-year, while sales have only grown 5%, can spark a meaningful conversation about efficiency.
Incorporate P&L reviews into client advisory meetings
Don’t let the P&L sit in an email attachment or a folder on the client’s desktop. Build reviews into your advisory sessions so you can walk through the numbers together. This turns the P&L into a strategic tool. Use it to discuss profitability, forecast cash flow, and plan for upcoming investments or tax obligations. Clients will see you not just as their accountant, but as a trusted advisor helping them make better business decisions.
From Numbers to Insights
A Profit and Loss Statement is more than a record of revenues, expenses, and profits; it’s a window into a business’s financial health. When prepared with accuracy and consistency, it reveals how profitable a company really is and how well it has performed over time.
But don’t stop at preparation. The real value comes from interpretation. Use P&Ls to guide decisions, forecast the future, and spark meaningful advisory conversations with clients. That’s where you shift from simply reporting the numbers to delivering insights that drive growth.
Of course, managing P&Ls across multiple clients can be time-consuming without the right systems in place. That’s where Financial Cents comes in. It helps you:
- Standardize P&L reporting work across all clients.
- Automate recurring financial reporting tasks easily.
- Track client deliverables and deadlines to ensure accuracy and avoid delays.
With Financial Cents, you can simplify the busywork of P&L reporting, stay on top of every deadline, and create a consistent experience across all your clients. That way, your focus stays where it matters most, delivering insights and strategic guidance.


