
When was the last time you looked at your profit and loss statement and couldn’t understand why the net income was so low?
You know that busy seasons were intense. Staff worked weekends and late evenings. Work got done. Hours were logged. And clients were served. But as you reconcile what you billed against the work your team did, you find there’s a gap, and it’s not small.
The metric for measuring exactly how much of that is happening, and how often, is called the realization rate. Most firm owners have heard about it. Few track it consistently, and even fewer use it to make actual pricing and operational decisions.
Speaking of operational decision-making, if your team is busy sunup to sundown, but your month-end projects still take multiple weeks, or advisory engagements are taking a back seat, you’re likely interpreting your efficiency levels wrongly. Learn how to measure and improve efficiency in your accounting firm.
Again, if your firm bills $100K but should be billing $115K, the realization rate is the conversation worth having. And by the end of this guide, you’ll understand what realization rate means, the two realization formulas every firm should know, what a healthy realization benchmark looks like for a small and mid-sized firm, and how to improve it.
TL;DR
- Realization rate measures how much of your team’s recorded work actually becomes billed or collected revenue. That makes it one of the clearest profitability indicators for accounting firms.
- Accounting firms commonly track two forms of realization: Billing Realization (work converted into invoices) and Revenue Realization (invoiced revenue actually collected).
- Healthy firms operate between 85-95% realization. Rates below 80% usually indicate operational or pricing leakage, while anything below 70% is a major warning sign.
- Realization commonly declines because of scope creep, underpriced engagements, slow client document delivery, write-downs, missed time entries, and inefficient internal workflows.
- Improving realization requires operational solutions through stronger engagement, scoping, workflow standardization, automation, daily time tracking, and regular repricing.
- Tools like Financial Cents practice management help firms monitor realization in real time by automatically tracking write-downs, profitability, margins, and realization across clients, projects, team members, and service lines.
What is the Realization Rate in Accounting?
Realization rate is the percentage of the value of time your team recorded at standard rates that actually turns into cash collected from clients. It measures how much of the work your accounting firm produces actually turns into billable revenue.
A high realization rate shows that most of your team’s work is being captured and converted into revenue. A low realization rate shows that revenue is leaking somewhere between getting the work done and sending the invoice.
When realization declines, firms tend to compensate for shrinking profitability by working longer hours, taking on more clients, adding more staff, or raising prices. Unfortunately, all of these can fail to address the operational issues behind the revenue leakage.
Unlike pure hourly billing businesses, realization in accounting reflects not only discounting, but also hidden revenue leakage from scope creep on fixed-fee engagements, unrecorded advisory work, and excessive time spent on client follow-ups that never become billable.
Understanding this distinction changes how you interpret your operational data. If you treat low realization as purely a billing problem, you may focus only on invoices, collections, or fee increases.
We’ll talk more on that later, but it suffices (for now) to say that fixing the leak requires you to understand exactly where the cash is escaping. That is why you need to track the following two realization rates.
The Two Realization Formulas (and When to Use Each)
The two realization formulas are:
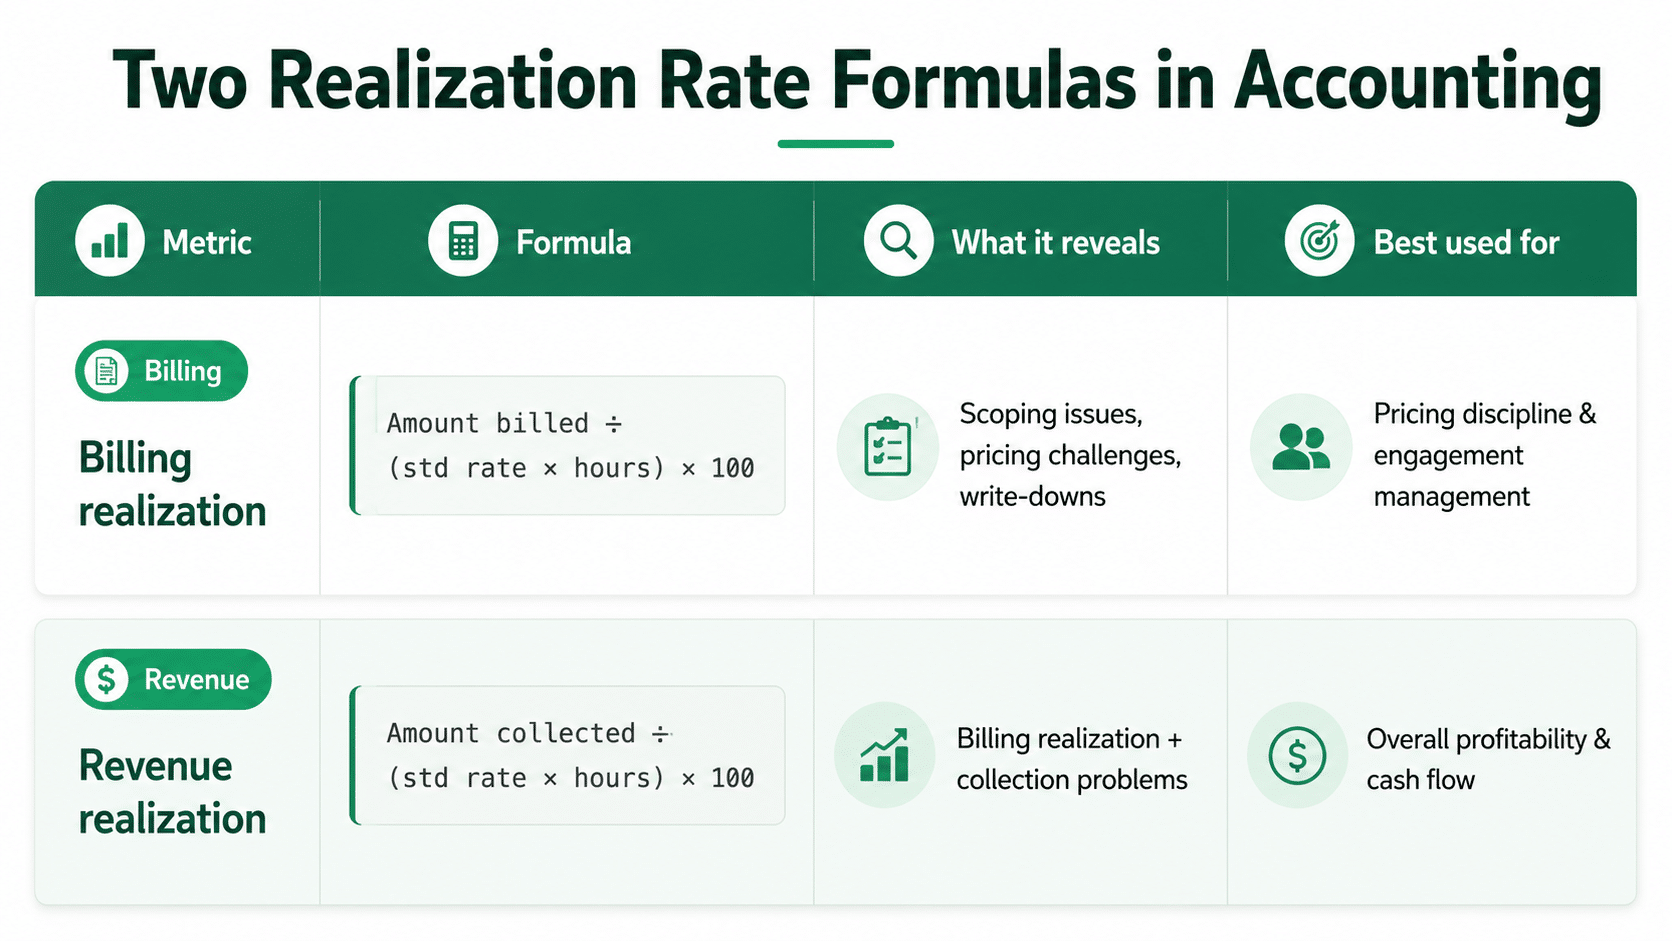
1. The Billing Realization Rate
The billing realization rate measures how much of the time your firm recorded at standard rates actually made it to the invoice sent to the client.
Tracking this metric helps you identify where you’re having issues with scoping, pricing, write-downs, or absorbing extra work.
When done well, you will be able to see the impact of scope creep on fixed-fee engagements, partners discounting bills, or writing off time spent waiting on client documents.
For example, your team records 20 hours on a monthly bookkeeping project. Your standard rate is $200/hour. Potential revenue = 20 × $200 = $4,000. But you billed $3,400
So, Billing Realization Rate = ($3,400 ÷ $4,000) × 100 = 85%
That means your firm absorbed a 15% write-down before the bill went out to the client.
When to use it: Use Billing Realization when you want to improve scoping, pricing, and client billing practices.
2. Revenue (Effective) Realization Rate
This is the “money in the bank” version. It shows what percentage of the potential revenue you actually collected in cash.
This formula factors collection problems (such as late payments, bad debts, and final write-offs) into the equation.
Using the example above, your team working 20 hours at $200 should produce $4,000. But you billed $3,400. After chasing the client, you could only collect $3,200 because the client disputed $200, and you wrote it off.
So, Revenue Realization Rate = ($3,200 ÷ $4,000) × 100 = 80%
When to use it: Use Revenue Realization to understand your true bottom-line profitability and the effectiveness of your cash collection process.
To keep your practice healthy, you must track both numbers side-by-side to identify the source of your revenue challenges.
If you only track Billing Realization, you might look at an 85% rate and think your firm is doing well. You’ll miss the fact that your clients are renegotiating invoices or failing to pay them altogether.
The higher the gap between the two metrics, the bigger the disconnect between your pricing and receivables collection system.
Difference between Realization Rate, Utilization Rate, and Collection Rate
If you mix up these three metrics, you’re not alone. Many firm owners do. While realization, utilization, and collection rate all help with understanding efficiency in accounting firms, each one evaluates a different aspect.
If you can’t tell them apart, you could confuse your firm’s performance in one area for another, which would make your operational decisions less effective, if not counterproductive.
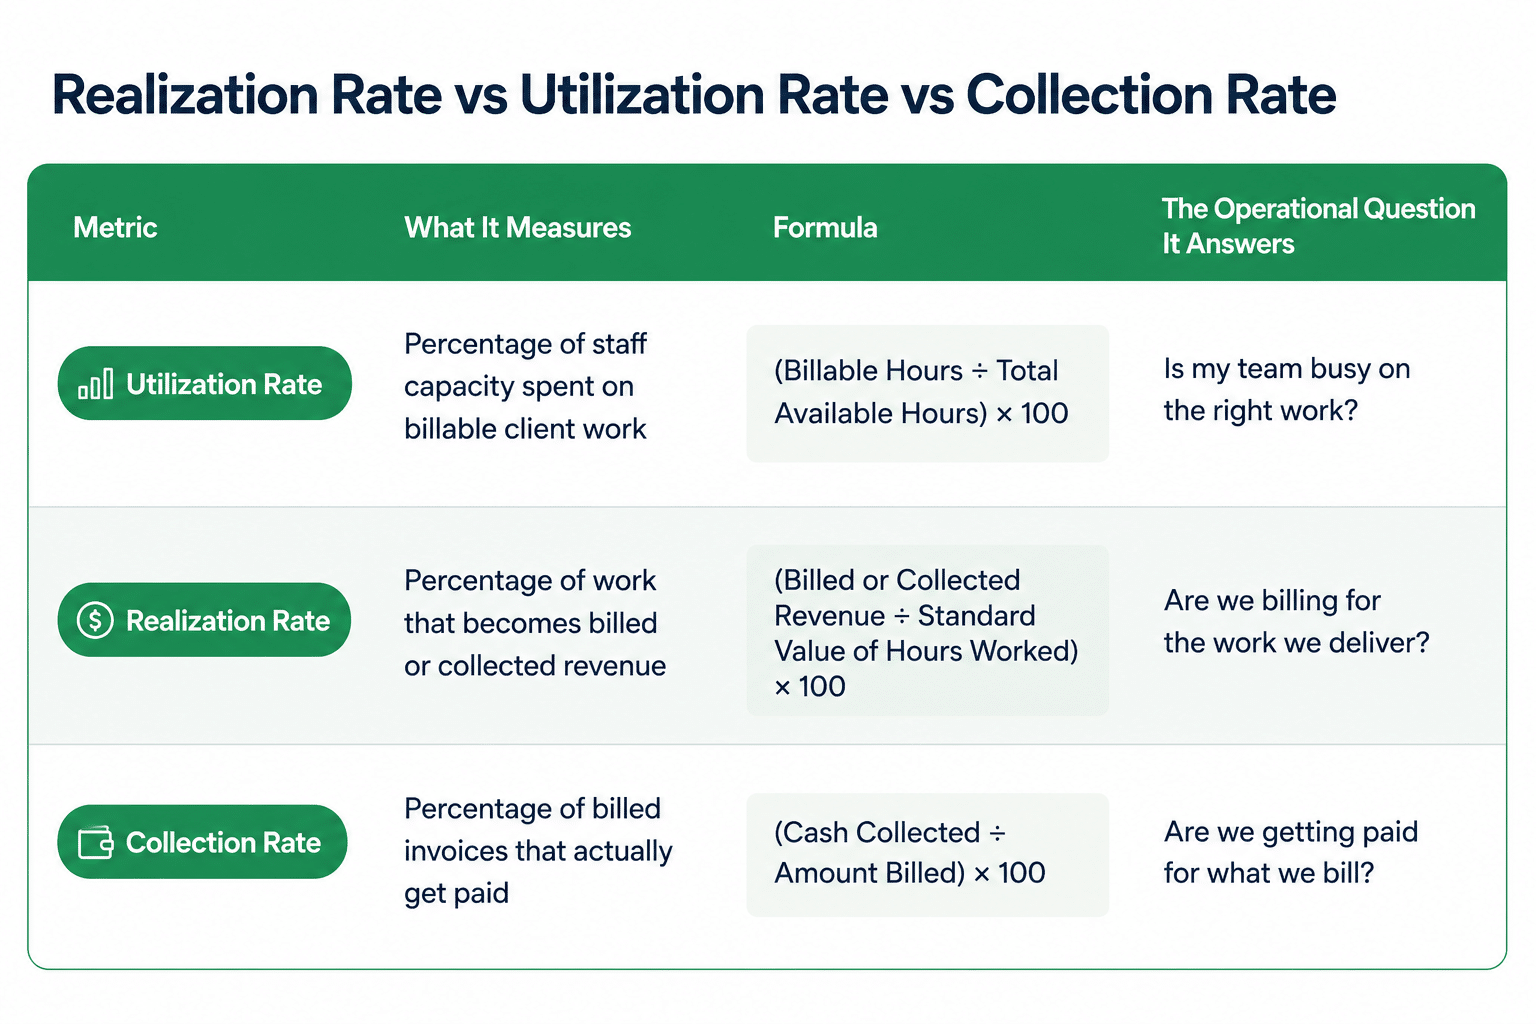
- Utilization Rate: This is about capacity and busyness. It tells you whether your team members are spending enough time on client work versus admin, training, or non-billable tasks.
- Realization Rate: This measures billing efficiency. It shows how much of the time you record at standard rates survives write-downs, scope creep, discounting, and fixed-fee overruns to become actual revenue.
- Collection Rate: This is about getting paid on what you’ve already invoiced. It ignores write-downs and focuses only on the efficiency of your receivables and follow-up system.
For example, a firm may have high utilization because staff is extremely busy, while:
- Realization remains weak because work is underpriced or written down.
- Collections lag because clients don’t pay on time or dispute your invoices.
Tracking all three metrics is important for firms that want to have a complete picture of their financial health. The healthiest accounting firms perform well across all three areas because each metric reveals a different operational problem:
- High utilization with low realization means staff are busy, but engagements are underpriced, workflows are inefficient, or clients are over-serviced.
- High realization with weak collections signals receivables or payment problems.
- A strong collection system is important, but realization will remain poor if you continue to underbill your clients.
To see your effective billing rate, multiply all three metrics together. That is:
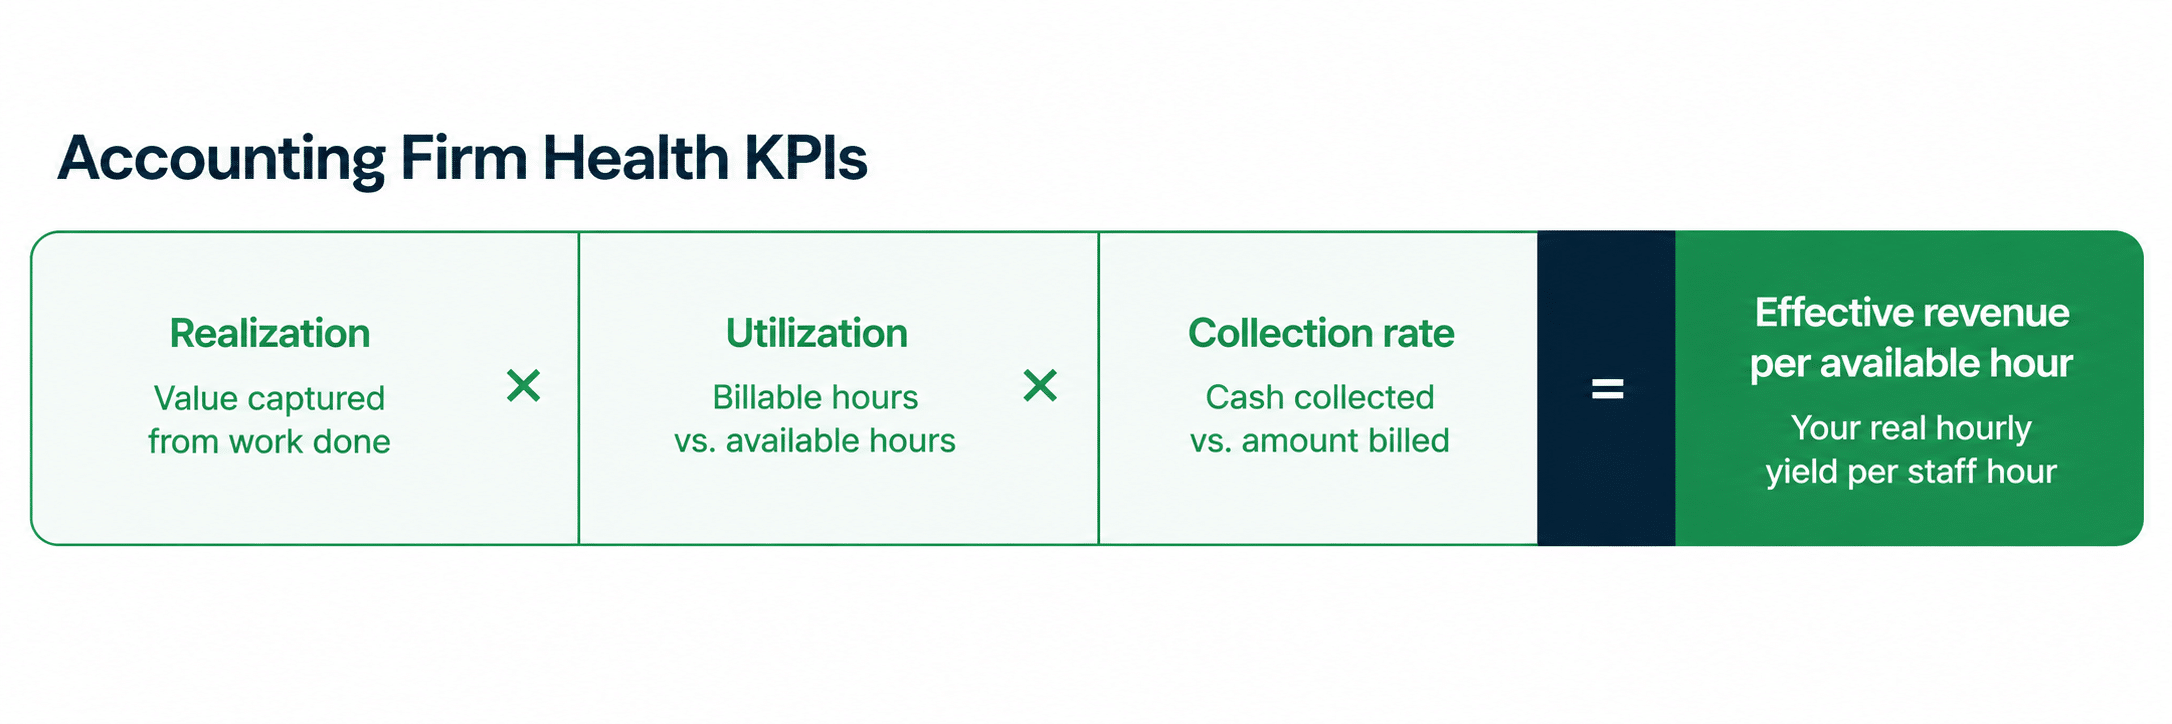
If your team is 80% utilized, achieves 85% realization, and has a 95% collection rate, your overall operational yield is 64.6%.
This means that for every $100 of potential revenue your firm could generate (assuming your team worked 100% billable hours, at full standard rates, with perfect billing and 100% collection), you are only bringing in $64.60.
You are leaving 35.4% of your potential revenue on the table, no thanks to the combined effect of all the leaks in your system (such as non-billable time, write-downs, scope creep, discounts, and uncollected invoices).
Even a 5% improvement in those metrics could significantly change your firm’s profitability without adding more clients or team members.
What’s a Good Realization Rate for an Accounting Firm?
A realization rate between 85% and 95% is a healthy level for a small or mid-sized accounting firm.
That figure shows that the firm is pricing work appropriately, managing scope effectively, capturing billable work consistently, keeping write-downs under control, and operating with reasonable workflow efficiency.
When your realization consistently falls outside that range, it usually points to deeper operational or pricing problems.
Here are the general benchmarks for realization rates in the accounting industry.
- Above 95%, the firm has strong pricing power, tight scoping, disciplined workflows, and efficient operations.
- Between 85 and 95% shows a healthy range for most accounting and bookkeeping firms.
- Below 80% signals scope creep, underpriced engagements, workflow inefficiencies, or chronic write-downs
- Below 70% is a major profitability warning sign; pricing model, scoping discipline, or broken operational systems.
What the Different Benchmark Levels Usually Say About the Firm
- A realization Rate Above 95% shows a strong operational maturity. It is more common among niche firms and firms with strong pricing confidence, tightly controlled scope, standardized workflows, etc. These firms have built a strong alignment between pricing, delivery, and operational execution.
- A Realization Rate between 85 and 95% is a healthy operating range that shows a firm that recovers most of the value the team produces and maintains normal flexibility. The realization is not perfect because the firm occasionally absorbs minor scope changes, internal inefficiencies, client communication overhead, and small write-downs.
- A Realization Rate Below 80% shows a firm that is delivering significantly more labor value than it is recovering in revenue. This should trigger an immediate investigation, which could point to scope creep, underpriced engagements, poor workflow management in an accounting practice, or untracked or missed billables as the culprit.
- A Realization Rate Below 70% should send alarm bells ringing because the firm is misaligned at a fundamental level, from pricing structure and scoping discipline to accounting workflow systems and billing processes. If left unresolved, this realization rate can destroy margins even when revenue growth appears healthy on paper.
Meanwhile, Benchmarks Vary by Service Line
There’s one important detail to keep in mind, and that is that realization benchmarks vary depending on the type of accounting work you are delivering.
That is because different accounting services require slightly different operational approaches and timelines.
For example
- Tax preparation often results in higher realization because tax compliance workflows are linear, repetitive, and highly standardized. Form 1040 or 1120 has a clear beginning, middle, and end.
- Accounting advisory services usually realize lower because advisory engagements evolve dynamically and frequently expand beyond the original assumptions.
A client engagement that starts as a simple cash-flow forecasting project can easily spiral into restructuring their entire internal accounts payable workflow.
- Monthly bookkeeping can produce different outcomes:
- High Realization (Operation Efficiency): If your monthly recurring fees are priced accurately, and your software automatically handles document collection.
- Low Realization (Scope Creep): If a fixed-fee client’s transaction volume doubles and they add two new corporate credit cards that increase your staff’s logged hours, while the monthly fee stays the same.
At the end of the day, an accurate firm-wide realization rate can hide serious profitability problems within individual service categories, client segments, or engagement types.
Protecting your realization rate is one major way you can expand your profitability without increasing customer acquisition costs.
Data from Financial Cents’ 2024 Accounting Firms Revenue Report showed that firms scaling into the mid-size bracket (6 to 10 employees) generated an average revenue of $741,166, while firms with 11 to 20 employees scaled up to $1,093,330.
For these types of firms, a 5% drop in realization represents $35,000 to $50,000 of profit leaking out of the firm.
Factors that Cause Realization Rate Slump
1. Scope creep on fixed-fee engagements
Scope creep causes a decline in realization in fixed-fee accounting engagements when the actual work required to service a client expands beyond what was originally agreed in the engagement letter.
Without strong scope controls, small incremental client requests accumulate into significant workload increases.
A basic bookkeeping engagement can gradually grow to include additional entities, payroll complexity, cleanup work, advisory requests, or new reporting requirements.
As this happens, staff spend more time on the client, while the monthly fee often remains unchanged. This scope expansion creates unbilled labor that the firm absorbs internally, reducing both profitability and realization.
2. Slow client document delivery that inflates hours
Slow client document collection process, which was the biggest workflow challenge for accounting firms in 2025, also drives realization decline because these delays reduce the time available for actual client work and create inefficiencies throughout the engagement.
Team members spend additional time following up with clients, deadlines become compressed, and work is often rushed to meet reporting requirements. This leads to rework, errors, and additional review time.
The result is inflated actual hours that are difficult to bill directly to clients, since most firms cannot easily charge for administrative delays or rework caused by missing information.
3. Discounts and write-downs
Every time you reduce an invoice before sending it to a client, your realization rate declines because a smaller portion of the work performed is converted into revenue.
While write-downs are sometimes justified, like when a junior accountant spends more time than expected to resolve a complex bank reconciliation issue, and the firm chooses not to pass the full cost to the client, many write-downs are driven less by policy and more by discomfort around client conversations.
Over time, these discretionary reductions erode a significant portion of monthly revenue.
4. Billing errors and missed time
A surprising amount of realization leakage occurs when work is not accurately recorded. This happens when time is entered late (or not at all), especially by junior staff who may not fully understand the connection between their timesheets and firm revenue.
For example, a junior staff member may record time days later, forget administrative client work, underreport hours (so he doesn’t appear inefficient), or fail to log short advisory conversations altogether.
When time tracking is incomplete, it creates distorted pricing data, makes engagement profitability harder to measure, and leads to unreliable estimates for future work.
5. Underpriced engagements
Many growing practices struggle to adjust pricing for long-term clients. They retain fee structures they set years ago that no longer reflect the effort currently required to deliver the work.
Meanwhile, as these firms scale, client complexity increases, software systems evolve, and compliance requirements become more demanding. In such cases, realization is not primarily an efficiency problem. It is a pricing structure problem.
If pricing does not adjust alongside this growing workload, the hours required to complete standard engagements will consistently exceed the revenue they generate, which will lead to weak realization.
If you intend to rework your fees, you should read our price increase letter for accounting firms guide to help you communicate to clients effectively.
6. Inefficient internal processes
Operational inefficiencies such as poor task ownership, manual status updates, searching for files or email threads, and delays caused by approval bottlenecks all increase the amount of time spent on engagements without increasing revenue.
These inefficiencies inflate recorded hours while adding little or no additional value that can be billed to the client. As a result, firms with disorganized workflows experience weak realization even when their pricing structure appears reasonable on paper.
As operational friction increases within a firm, billable time is lost. Some of this time is written off, some is written down, and some is simply absorbed as unprofitable internal labor.
Speaking at WorkflowCon 2025, Ron Baker advised accounting firms against billing by the hour, as it hardly has any positive impact on their realization rate.
How to Improve Your Accounting Firm’s Realization Rate
These seven changes can significantly improve realization in any accounting firm:
I. Tighten engagement letters and define out-of-scope work.
Weak engagement scoping is one of the fastest ways to reduce realization. When engagement letters describe services too broadly, they create ambiguity around what is included and what requires additional billing.
That ambiguity often leads to unbilled work being absorbed into standard fees.
Strong engagement letters clearly define the scope of services, expected deliverables, client responsibilities, communication boundaries, turnaround times, and the pricing assumptions behind the engagement.
They also outline what constitutes out-of-scope work and what triggers a change order or additional fee.
For example, common change-order triggers include:
- Additional entities beyond the original engagement scope
- Cleanup work or historical reconciliations
- Late or missing bookkeeping requiring rework
- Advisory or consulting requests outside recurring services
- Etc.
In this article, we break down how to write engagement letters that protect your profit margins.
II. Automate client document collection
Manually chasing clients for documents is another common way to reduce realization. It results in delays and additional administrative time spent tracking client responses.
Automating the client document collection process through secure accounting client portals, automated reminders, and centralized communication systems significantly reduces this friction.
Instead of manually chasing clients, the system follows up with them and tracks outstanding requests in real time.
III. Track time daily for each work, not weekly
Accurate time entries improve billing systems and decisions and help staff understand the link between their work and firm profitability.
When staff wait until the end of the week to record their time, entries become less reliable. Small advisory tasks are easier to forget, context is lost, and estimates replace actual recorded time.
Daily time tracking significantly improves accuracy because work is recorded while it is still fresh. That way, your staff will log time while doing the work, instead of reconstructing the week from their memory.
Thankfully, many practice management platforms include built-in timers that allow teams to track time in real time as they work.
See this list of time and billing systems for accounting to help you streamline the process and prevent errors.
IV. Reprice Annually
Realization improves when firms adjust pricing quickly enough to reflect changes in costs, client complexity, and actual effort required to deliver services.
However, many firms keep pricing unchanged for years while workload demands increase steadily.
Annual repricing helps firms to reassess engagement complexity, resource requirements, and service expectations each year to ensure pricing remains aligned with current operational realities.
V. Shift to fixed-fee or value-based pricing where appropriate
Hourly billing remains the most common pricing model in accounting, but it can limit realization potential in highly efficient firms.
With hourly pricing, billing is based on the time spent on the work, which means improvements in efficiency levels reduce the total hours billed and caps revenue growth, even when delivery quality increases.
Fixed-fee and value-based pricing, on the other hand, separates revenue from time spent and instead ties fees to the scope of work or perceived client value. They allow firms to improve efficiency without reducing revenue, which strengthens realization over time.
VI. Document and standardize recurring work
When workflows are not standardized, team members duplicate efforts, miss important steps, deliver inconsistent services, and hand off tasks poorly.
These inefficiencies increase the amount of time spent on engagements without necessarily increasing billable revenue.
Documenting and standardizing workflows helps reduce this hidden labor by creating repeatable accounting systems for service delivery. As a result, less time is spent figuring out what needs to be done or correcting preventable errors.
Core service lines such as client onboarding, monthly bookkeeping, review, and tax preparation processes should be standardized with workflow templates, checklists, and standard operating procedures within your workflow system.
VII. Get visibility into the realization metric in real time
One of the biggest issues with the realization rate in accounting is monitoring. Most firms only identify realization problems after an engagement has been completed.
By that point, the labor has already been incurred, write-downs have already been applied, and the opportunity to adjust scope or pricing has passed.
To make the realization rate more useful, treat it as a leading indicator by monitoring engagement profitability while the work is still in progress.
The top practice management software for accounting firms makes this possible by providing real-time visibility into time tracking, budgets, and engagement performance.
Constant monitoring enables firms to address realization issues while the engagement is still on.
How to Track and Improve Realization Rate Using Financial Cents
The Financial Cents realization and profitability report helps accounting firms to monitor their realization rate in real time.
While many accounting practice management software solutions also offer the realization report, most of them stop at the overall firm level.
But Financial Cents’ realization report gives firms complete visibility into realization across clients, team members, and service items to identify and fix the problem at the source.
What the Financial Cents Realization & Profitability Report shows
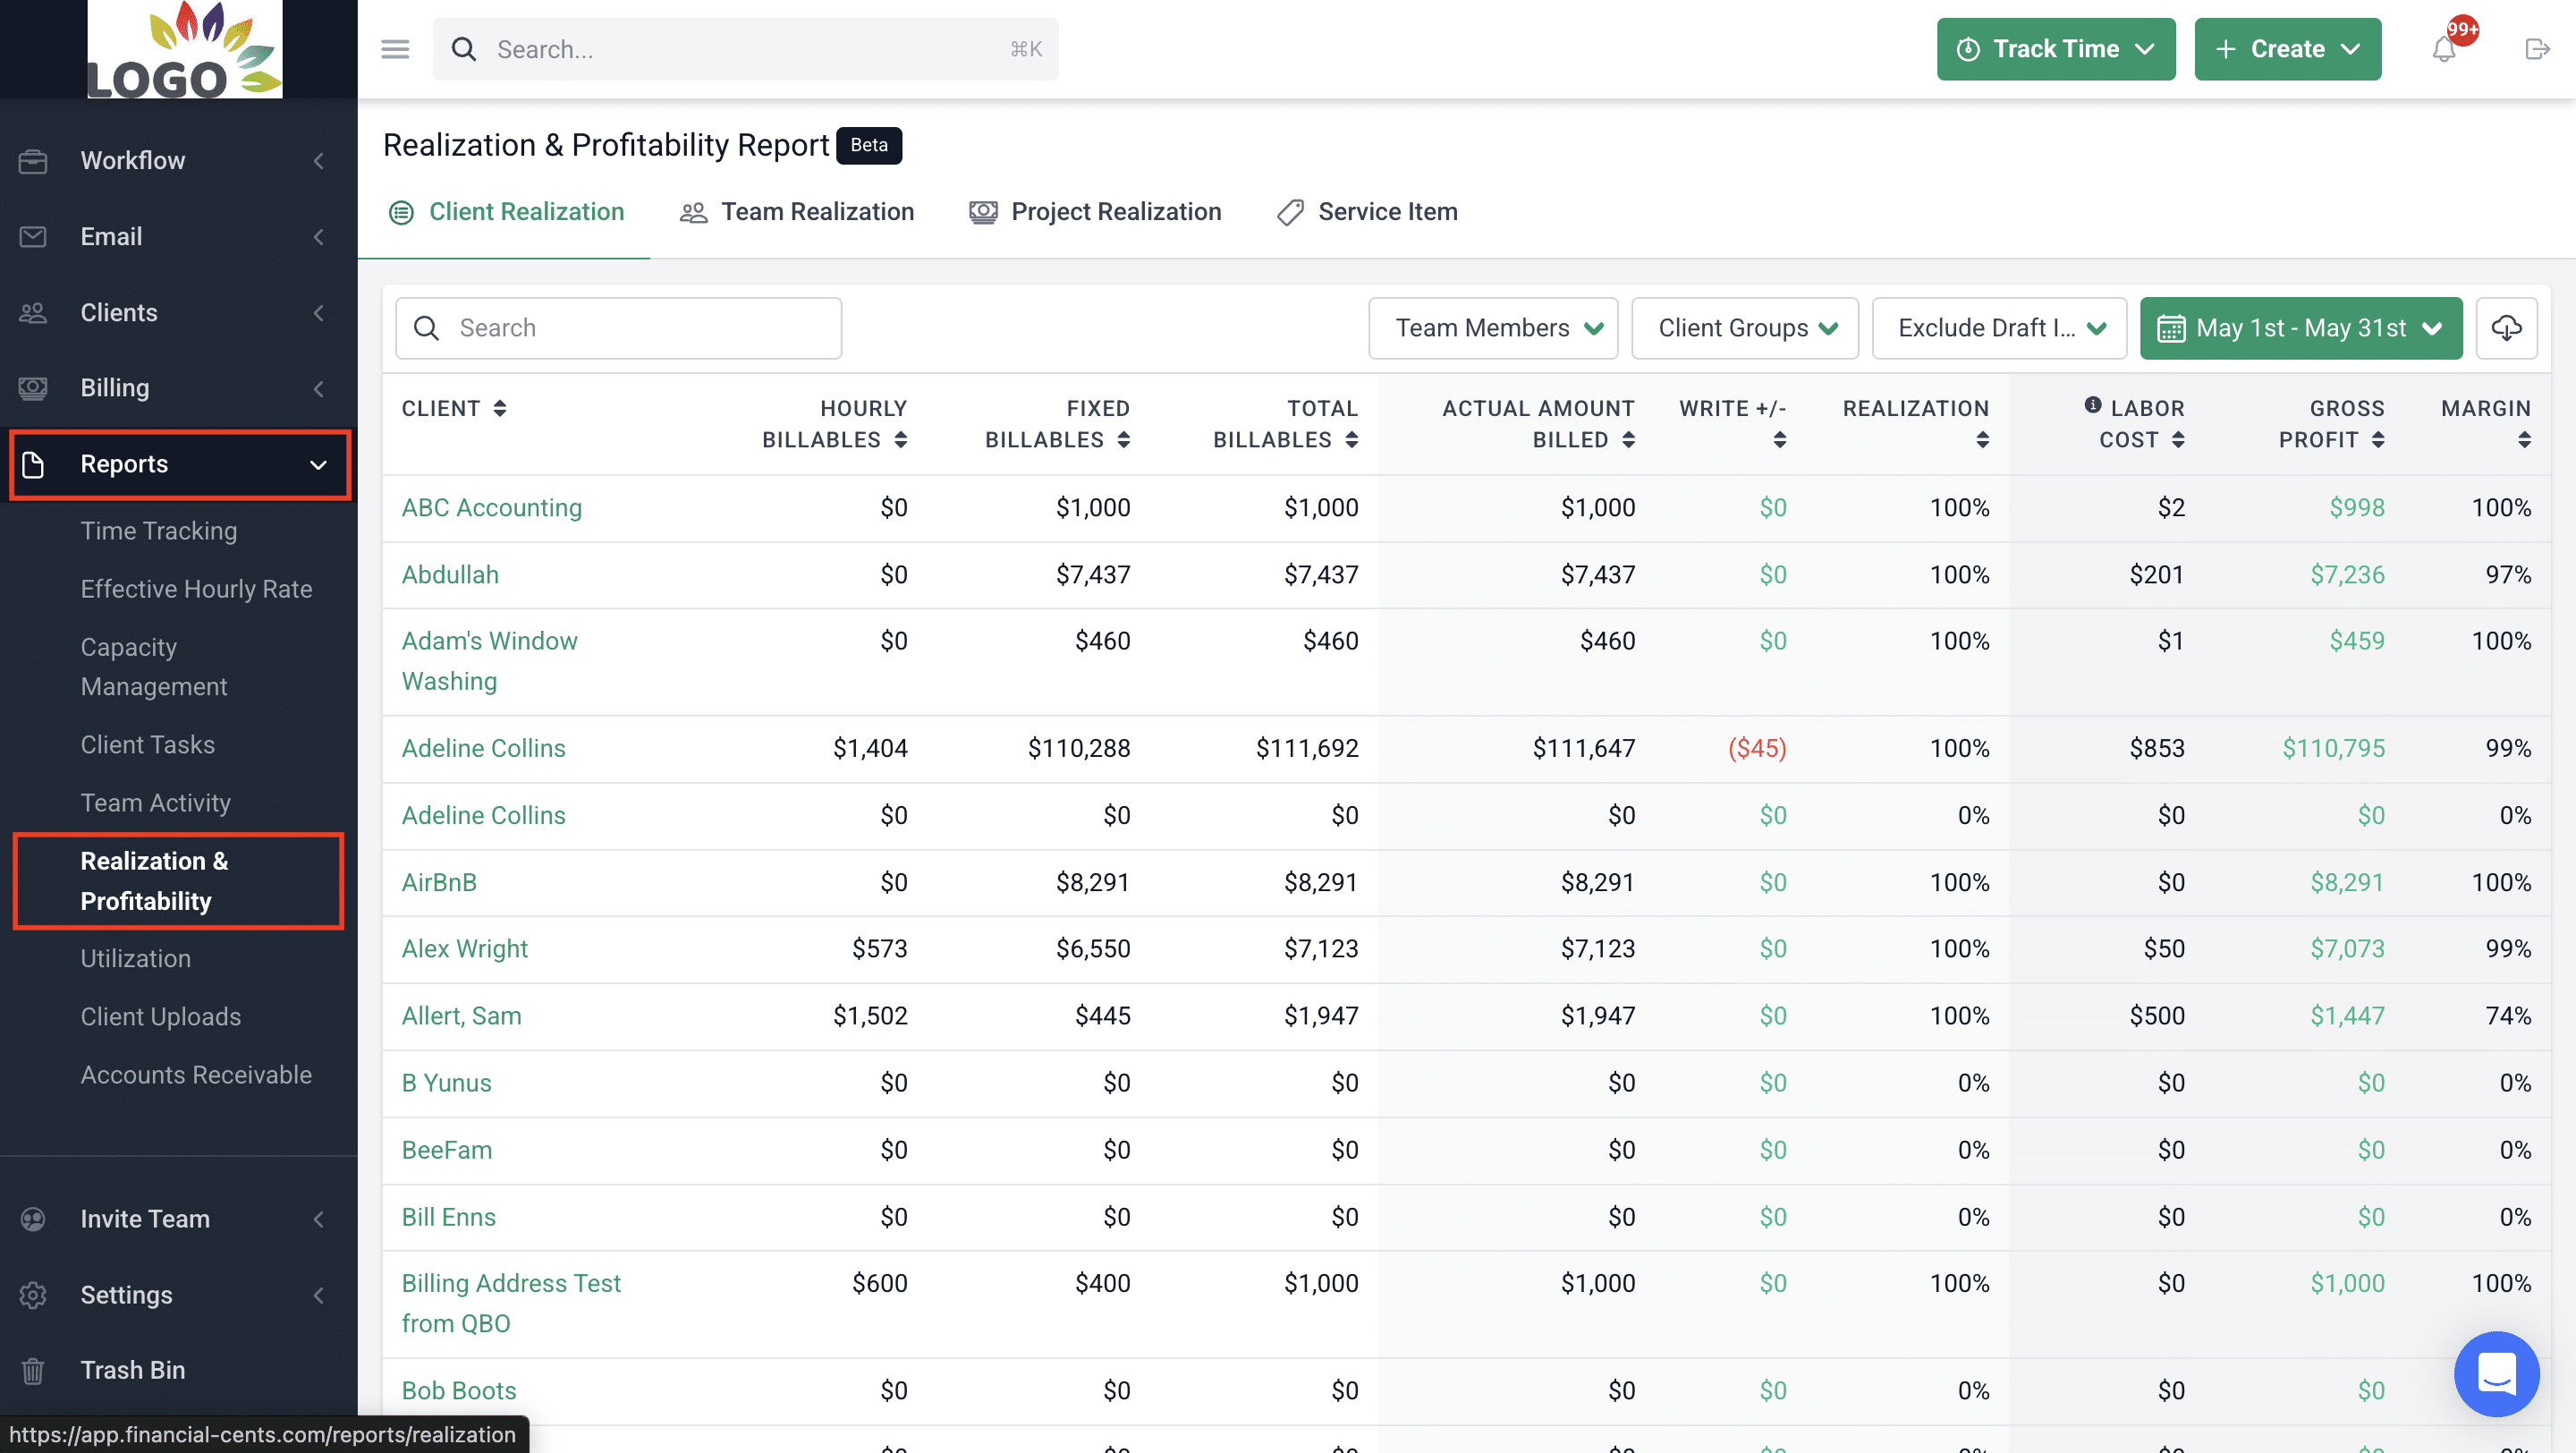
Here is how to interpret the Financial Cents Realization Report above:
- Hourly billables: Shows the standard billable value of hourly work based on tracked time and billing rates to help firms compare expected revenue against actual invoicing.
- Fixed billables: Tracks revenue tied to fixed-fee engagements so firms can evaluate whether recurring or packaged services are being delivered profitably.
- Total billables: Combines hourly and fixed-fee billables into a unified production value view across the firm.
- Actual amount billed: Displays the real invoice amount sent to clients after any pricing adjustments, discounts, or scope-related billing decisions.
- Write +/-: Shows how much value was added to or removed from invoices to make it easier to identify chronic discounting or underpricing patterns.
- Realization: Calculates how much of the standard production value actually became invoiced revenue so firms can monitor engagement recovery rates in real time.
- Labor cost: Tracks the internal labor cost associated with delivering the work to help firms evaluate operational efficiency alongside realization.
- Gross: Shows how much profit remains after labor costs are removed from billed work to give firms direct visibility into engagement profitability.
- Profit Margin: Displays the profit percentage earned on engagements so firms can quickly identify which clients, projects, or services are financially healthy.
The Financial Cents Differentiator: Realization Plus Profitability
This is another area in which Financial Cents separates itself from other practice management or realization reporting tools.
While most realization reports only tell you how much of the work was billed. Financial Cents goes beyond that to add your profitability metrics to the realization data.
- Instead of only seeing:
“This engagement was realized at 78%.”
- You will see:
“This engagement was realized at 78% and produced a 12% margin.”
That additional data changes the quality of decision-making because low realization alone does not always explain the operational problem. The profitability context helps with determining whether you need to reprice the engagement, tighten scope boundaries, improve workflow efficiency, or disengage from unprofitable clients altogether.
Important Details on The Financial Cents’ Realization and Profitability Report
- You must invoice through Financial Cents to use the Realization & Profitability Report.
The report is calculated from the data in the Financial Cents Billing solution. You have to invoice through the platform for the realization and profitability metrics to be accessible.
- Realization is Based on Invoices Sent (Not Payments Collected)
Financial Cents tracks realization based on invoice revenue, not collected cash.
To get the full collection data, the realization report must be paired with Financial Cents’ Accounts Receivable Aging Report. These two reports help firms separate billing leakage from collections leakage.
- Invoice Adjustments Automatically Create Write-Ups or Write-Downs
When firms adjust invoice amounts inside Financial Cents, the system automatically records the difference as a write-up or write-down.
No manual adjustment process is required. This automation eliminates administrative overhead and provides firms with cleaner realization reporting.
Start tracking your firm’s realization and profitability in one dashboard ( broken down by client, team, project, and service) today. Book a Free Walkthrough Demo.
Visibility Is the Foundation of Better Realization
Improving realization is not about pushing your staff to work longer hours. It is about building stronger operational systems around pricing, scope control, workflows, billing, and client collaboration.
But that improvement starts with visibility. When firms only review realization at month-end or year-end, profitability problems are discovered after the revenue has already been lost. The most effective firms monitor realization while engagements are still active.
That is where modern practice management systems like Financial Cents provide an operational advantage.
Instead of treating realization as a historical reporting metric, Financial Cents gives firms real-time visibility into realization, profitability, margins, write-downs, and engagement performance across clients, projects, service lines, and team members.
With that visibility, you can make faster operational decisions to address the causes of revenue leakage before they hurt your profit margins.
To get clearer insight into which clients, projects, or workflows are reducing your realization rate, try Financial Cents free for 14 days.
Frequently Asked Questions
Realization Rate = (Actual Amount Billed or Collected ÷ Standard Value of Hours Worked) × 100
Example:
If your staff records $10,000 worth of work but the firm invoices only $8,000, the realization rate is 80%.
- Below 80% often signals pricing, scoping, or operational inefficiencies.
- 90%+ reflects strong scope control, pricing discipline, and efficient workflows.
- Utilization rate measures the percentage of staff time spent on billable work.
- Realization rate measures the percentage of recorded work that becomes revenue.
- Collection rate measures how much invoiced revenue is actually collected.
Together, these metrics provide a more complete picture of firm profitability and operational performance.


